Modern organizations navigating the analytics landscape face a pivotal choice: should they empower users through spreadsheet native analytics that democratize data exploration, or should they invest in visual storytelling dashboards that communicate insights through polished, design driven narratives?
This comparison examines Diacto’s service offerings for Sigma Computing and Tableau, exploring how these two distinct approaches spreadsheet native versus visualization centric align with differing data strategies, user personas, and architectural philosophies.
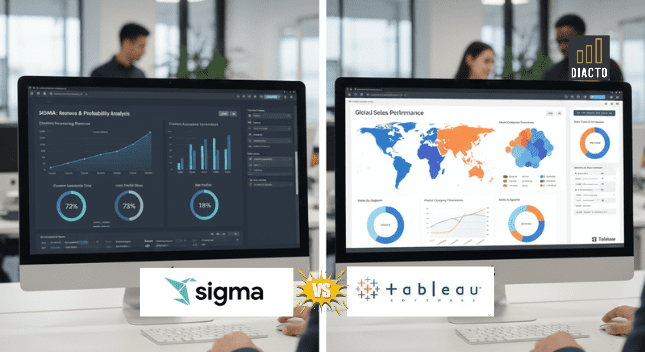
Diacto’s Sigma services emphasize cloud native, spreadsheet style analytics tightly integrated with modern data warehouses.
The offering centers on six pillars:
Diacto’s positioning of Sigma reflects a philosophy of empowering data literate business users within a governed, warehouse centric ecosystem, emphasizing agility and low friction analytics adoption.
Diacto’s Tableau services revolve around visual storytelling and insight communication, with an emphasis on design excellence and scalability.
The practice comprises six key offerings:
Diacto positions Tableau as a creative, visualization centric BI platform that helps organizations transform data into compelling narratives, an approach designed for executive decision making.
The contrast between Sigma and Tableau stems from their analytical philosophies and data architectures.
Sigma’s Architecture is warehouse centric, where the cloud data warehouse remains the single source of truth. Sigma acts as a live query interface, directly reading and writing to warehouse tables in real time. There is no data extraction or proprietary storage layer all analysis happens natively within the warehouse environment. This design supports strong governance, immediate scalability, and alignment with modern data engineering practices.
Tableau’s Architecture, on the other hand, is visualization centric. Tableau extracts or connects to data (live or via extracts), processing it within its proprietary visualization engine to deliver optimized performance and interactivity. This approach enables rich visual design and fast rendering for large datasets but may require additional data preparation or extracts management.
From an implementation standpoint, Sigma supports rapid deployment due to its direct cloud integrations and spreadsheet style modeling. Tableau implementations, by contrast, often involve iterative design cycles, data modeling refinement, and dashboard performance tuning, reflecting its visual storytelling emphasis.

Choose Sigma When:
Licensing and Cost Structures: Diacto provides licensing advisory services for both solutions.
Technical Integration Requirements:
Skills and Staffing Implications:
Organizations should assess whether their teams lean toward data engineering or visual communication when selecting between these options.
Before committing to either platform, organizations should request clarity on several key points not fully detailed in Diacto’s overviews:
1. Performance Metrics: What are the typical response times for complex queries or dashboards under enterprise loads?
2. Scalability: How do licensing models scale with growing user bases or data volumes?
3. Security and Compliance: Request documentation of SOC2, GDPR, or ISO certifications, along with data residency options.
4. Customization Examples: Review case studies showing Sigma Data Apps or Tableau Embedded Dashboards in production.
5. Implementation Timelines: Request sample project plans and resource requirements to validate expected deployment speed.
6. ROI Evidence: Seek tangible examples of productivity gains, cost savings, or business outcomes achieved through Diacto’s implementations.
The decision between Sigma and Tableau reflects not just a tool preference but a philosophical choice in how your organization engages with data.
Both approaches can coexist within hybrid analytics environments, but success ultimately depends on aligning the chosen path with your data maturity, team competencies, and communication goals. The key is an honest assessment of whether your organization’s culture leans toward data exploration and operational agility (Sigma) or visual storytelling and executive insight (Tableau).