For many US mid-market companies, business intelligence has moved beyond “better dashboards.” In 2026, the highest-return BI programs are becoming decision systems: governed data, reusable metrics, automated pipelines, AI-assisted analysis, and embedded insights that help teams act faster in sales, finance, operations, customer success, and supply chain.
That shift matters because mid-market firms often sit in the hardest part of the data maturity curve. They have enough complexity to suffer from disconnected systems, manual reporting, inconsistent KPIs, and rising compliance risk—but not always the enterprise-sized data teams or budgets to solve everything at once. Modern business intelligence closes that gap by combining cloud data platforms, semantic layers, ELT, governance, and AI/LLM analytics into practical intelligence solutions that can be rolled out in stages.
The future of BI is not a single tool. It is an operating model for making trusted decisions repeatedly, quickly, and at scale. Gartner’s 2026 data and analytics trends emphasize AI agents, semantics, converged data and analytics platforms, decision governance, and real-time intelligence as major forces shaping analytics programs. Those themes align with what mid-market companies are seeing in practice: leaders want self-service analytics, but they also need guardrails so AI-generated insights and automated decisions are explainable, auditable, and tied to business outcomes. (gartner.com)
Traditional BI often focused on periodic reporting: a weekly sales pack, a monthly financial close dashboard, or a static executive scorecard. Modern BI keeps those essentials, but adds governed metrics, automated data movement, predictive signals, natural-language querying, and workflow integration. TechTarget’s 2026 BI trend coverage highlights data warehouse modernization, lakehouses, real-time analytics, semantic layers, analytics as code, and embedded analytics as core trends in the future of business intelligence. (techtarget.com)
For mid-market companies, the economic opportunity is not just “more insight.” It is less rework, fewer manual reconciliations, faster pricing decisions, tighter inventory control, better sales forecasting, lower cloud waste, fewer compliance surprises, and more consistent execution across departments.
Savings usually come from multiple smaller levers rather than one dramatic breakthrough. A $200 million manufacturer, distributor, healthcare services firm, SaaS company, or multi-location retailer may not save millions from dashboards alone. But it can save millions when BI improves how people price, buy, forecast, staff, collect cash, manage churn, and detect exceptions.
A common mid-market pattern is the “spreadsheet supply chain.” Finance exports from the ERP, sales exports from the CRM, operations exports from a WMS or service platform, and each department rebuilds its own numbers. By the time leadership meets, teams spend the first 20 minutes debating which revenue, margin, backlog, or customer count is correct.
A modern BI stack reduces that waste by automating ingestion, transformation, testing, and metric definitions. The savings are straightforward to model:
That is only one workflow. Add finance close reporting, sales pipeline reviews, inventory analysis, board reporting, and customer profitability analysis, and seven-figure annual value becomes realistic for many mid-market organizations.
Margin leakage is often hidden in inconsistent discounts, outdated cost assumptions, freight variances, rebates, service credits, warranty claims, sales tax issues, or customer-specific contract terms. Modern BI can combine ERP invoices, CRM opportunities, procurement costs, shipping data, and customer master data to show where gross margin is drifting.
Consider an illustrative $250 million distributor with 24% gross margin. If better pricing and cost-to-serve visibility improves realized margin by only 0.5 percentage points, that is $1.25 million in annual gross profit. If the company also catches unprofitable freight policies, late vendor rebates, or customer-level exceptions, the impact can compound.
The key is not a prettier margin dashboard. The key is a governed profitability model that everyone trusts and uses in pricing reviews, account planning, vendor negotiations, and branch operations.
For companies with physical goods, BI savings often show up in inventory turns and working capital. A cloud warehouse or lakehouse can integrate sales orders, purchase orders, inventory snapshots, supplier lead times, forecasts, and historical seasonality. That makes it easier to spot slow-moving SKUs, chronic stockouts, regional imbalances, and forecast bias.
A simple example:
Mid-market companies often have enough inventory complexity to benefit from this analysis, but they may not need a full enterprise planning transformation before seeing value. A focused BI use case around inventory exceptions, forecast accuracy, and supplier performance can produce measurable savings within months.
Modern BI can connect order management, invoicing, collections, customer contracts, and support tickets to reveal late billing, disputes, renewal risk, unapplied cash, and customers with deteriorating payment behavior.
For a $150 million services company, reducing days sales outstanding by even a few days can free significant cash. For a subscription or recurring-revenue company, identifying churn signals earlier can protect revenue. For a project-based company, connecting utilization, billing milestones, and margin can prevent write-offs before the quarter closes.
The strongest BI programs do not stop at “what happened?” They create exception queues: customers at risk, invoices likely to be disputed, projects trending over budget, sales deals with margin below policy, or branches with unusual return rates.
Modern BI can also reduce the cost of analytics itself. Many mid-market companies have accumulated overlapping BI tools, duplicated data extracts, underused licenses, unmanaged warehouse compute, and hundreds of reports that no one owns.
A rationalized BI environment can save money by:
The goal is not always to choose the cheapest tool. The goal is to reduce the total cost per trusted decision.
As BI programs expand into AI and self-service analytics, data governance becomes a financial control. IBM’s 2025 Cost of a Data Breach report states that the global average breach cost was $4.4 million and highlights an “AI oversight gap,” including risks from ungoverned AI systems, missing AI access controls, and shadow AI. It also reports $1.9 million in cost savings from extensive use of AI in security compared with organizations that did not use those solutions. (ibm.com)
That does not mean a BI program alone prevents a breach. It does mean modern BI architecture should reduce avoidable risk by enforcing access controls, masking sensitive data, maintaining audit logs, classifying data, and preventing unmanaged AI tools from querying raw customer, employee, or financial records.
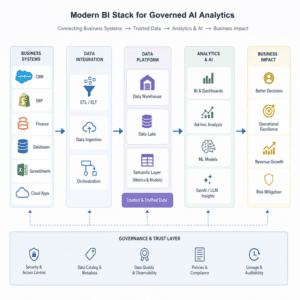
A modern BI stack is best understood as layers. Each layer has a job, and each layer should make the next one more reliable.
Most mid-market BI starts with operational systems: ERP, CRM, finance, HRIS, marketing automation, ecommerce, WMS, TMS, customer support, product usage, billing, and industry-specific platforms. The first architectural question is not “Which dashboard tool should we buy?” It is “Which decisions require which source data, at what freshness, with what level of trust?”
Modern BI usually favors ELT: extract and load data into a scalable cloud platform, then transform it there. Common patterns include batch ingestion for stable reporting, change data capture for operational data, streaming for time-sensitive use cases, and orchestration for dependencies, retries, and monitoring.
For mid-market companies, ELT creates leverage because the same governed data can support finance reporting, sales analytics, customer analytics, operational dashboards, AI models, and embedded intelligence solutions without rebuilding one-off pipelines for every department.
The cloud data warehouse remains a strong fit for structured reporting, performance, and familiar SQL workflows. The lakehouse has become increasingly attractive where companies need a broader mix of structured, semi-structured, and unstructured data for BI, machine learning, and AI. Databricks describes a lakehouse as a data management system that combines benefits of data lakes and data warehouses, including open access, support for BI and advanced analytics, and lower-latency analysis. (docs.databricks.com)
The practical takeaway: choose the architecture based on your use cases. A finance-led reporting program may be well served by a cloud warehouse. A company combining IoT telemetry, documents, support transcripts, product events, and structured ERP data may benefit from a lakehouse or hybrid architecture.
Transformation is where raw data becomes business-ready data. This layer standardizes customers, products, dates, territories, revenue recognition logic, margin calculations, and other reusable models. In a modern BI program, transformation should be version-controlled, tested, documented, and observable.
This is where many mid-market firms unlock savings. Instead of rebuilding “net revenue” in 19 dashboards, the data team defines it once, tests it, and publishes it for reuse.
The semantic layer is one of the most important business intelligence trends in 2026 because it translates technical data into business terms. Microsoft describes Power BI semantic models as logical descriptions of analytical domains, using metrics and business-friendly terminology to enable deeper analysis. (learn.microsoft.com)
A strong semantic layer defines concepts such as active customer, booked revenue, net revenue, ARR, gross margin, on-time delivery, churn, pipeline coverage, and inventory availability. It also controls relationships, hierarchies, calculations, and security policies. This becomes especially important when LLMs or AI agents answer business questions, because they need governed business context rather than raw table names.
Governance is the difference between self-service and chaos. A governed BI environment includes data ownership, definitions, quality checks, lineage, access policies, change management, and monitoring. dbt’s 2026 guidance on semantic layers emphasizes centralized metric definitions, version control, role-based access controls, masking, audit trails, and consistent governance across downstream tools and AI applications. (getdbt.com)
For mid-market companies, governance should be lightweight but real. You do not need a 40-person data governance office to define metric owners, publish a data catalog, classify sensitive fields, and require review before KPI definitions change.
AI/LLM analytics allows business users to ask natural-language questions, summarize trends, generate explanations, create draft dashboards, or trigger analysis workflows. The opportunity is significant: McKinsey has estimated that generative AI could add $2.6 trillion to $4.4 trillion annually across analyzed use cases, while also noting that realizing benefits requires managing risks, changing workflows, and building new skills. (mckinsey.com)
In BI, the safest high-value AI use cases usually begin with governed data. Examples include:
The risk is letting AI query raw, poorly documented, or sensitive data without controls. The better pattern is governed AI: AI that uses approved metrics, applies access controls, cites data sources, logs interactions, and escalates uncertainty.
The final layer is where BI reaches the point of decision. Embedded analytics puts insights inside CRM, ERP, service, product, finance, or operations workflows so users do not need to leave their normal systems. TechTarget notes that embedded analytics can support real-time decisions and reduce the need for users to switch into a separate analytics application. (techtarget.com)
For mid-market firms, embedded BI can be more valuable than another executive dashboard. A salesperson sees margin guidance in the CRM. A purchasing manager sees supplier risk in the procurement workflow. A customer success manager sees churn signals inside the account view. A controller sees close anomalies in the finance workflow.
The best starting point is not the trendiest technology. It is the decision with the biggest measurable pain. Strong candidates include:
Create one governed view of revenue, margin, cash, pipeline, backlog, retention, operating expense, and working capital. This reduces meeting friction and supports faster course correction.
Automate recurring reporting, standardize account mappings, identify anomalies, and generate first-draft commentary for month-end reviews. Savings come from shorter close cycles, fewer manual adjustments, and better budget accountability.
Connect CRM, bookings, billing, customer history, discounting, and margin. Improve forecast accuracy, identify stalled deals, enforce pricing policy, and prioritize high-probability opportunities.
Combine revenue, cost-to-serve, support volume, product usage, payment behavior, and contract terms. This helps teams identify customers that need intervention, repricing, onboarding, or retention plays.
Track demand volatility, supplier performance, inventory aging, stockouts, lead times, and purchasing exceptions. This is often one of the fastest paths to measurable cash and cost savings.
For labor-intensive businesses, BI can connect demand, staffing, utilization, overtime, revenue per employee, schedule adherence, and quality metrics. Even modest improvements in utilization or overtime control can produce meaningful savings.
Build dashboards and alerts for access reviews, sensitive data usage, policy exceptions, audit readiness, consent status, retention windows, and third-party data sharing.
A mid-market BI transformation should be staged. Trying to modernize every report, system, and metric at once usually creates cost without adoption.
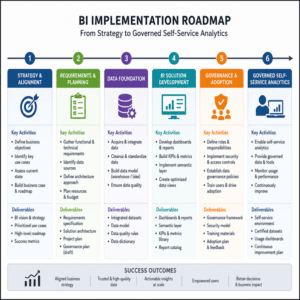
Start with 5 to 10 decisions that matter financially. For each decision, document:
This converts BI from an IT project into an operating improvement program.
Choose the initial platform architecture, connect priority sources, create ingestion pipelines, and establish development standards. Keep the first scope narrow enough to deliver value quickly, but design the foundation so it can scale.
Important foundation decisions include:
A data product is a trusted, reusable dataset or metric group that serves a business domain. Examples include sales performance, customer profitability, inventory availability, financial actuals, pipeline, workforce utilization, or product usage.
Each data product should have:
Data products are how mid-market companies avoid rebuilding the same logic in every dashboard.
Self-service works only when users can explore data without breaking definitions or exposing sensitive information. Start with certified datasets, governed semantic models, role-based access, and training for power users.
A good self-service rollout includes:
Introduce AI after core metrics and access policies are stable. Start with lower-risk use cases such as report summarization, variance explanation, dashboard drafting, documentation, and analyst productivity. Then move into conversational analytics and agentic workflows once governance is mature.
NIST’s AI Risk Management Framework is intended to help organizations incorporate trustworthiness considerations into the design, development, use, and evaluation of AI systems; NIST also released a generative AI profile to help organizations identify and manage risks specific to generative AI. (nist.gov)
For BI teams, responsible AI controls should include:
Once BI is live, manage it like a product portfolio. Retire unused dashboards, monitor cloud spend, track query performance, measure adoption, and compare business outcomes to the original value case.
A modern BI program should measure its own performance. Useful KPIs fall into six categories.
The most persuasive ROI story ties platform KPIs to business KPIs. “We delivered 200 dashboards” is not a value case. “We reduced close reporting by four days, identified $900,000 in margin leakage, and retired $250,000 in redundant analytics spend” is.
US mid-market companies need to treat BI as part of their security and compliance environment, not as a side reporting tool. The privacy landscape is especially fragmented. The IAPP state privacy tracker follows comprehensive US state consumer privacy bills and maps common consumer rights and business obligations, reflecting the continuing state-by-state development of privacy requirements. (iapp.org)
Security and compliance requirements vary by industry, state, customer contracts, and data type, but most BI programs should address the following controls.
Classify data before broad self-service rollout. Common categories include public, internal, confidential, restricted, regulated, personally identifiable information, protected health information, payment data, employee data, and customer confidential data.
Use SSO, MFA, least-privilege access, role-based or attribute-based access controls, and regular access reviews. Avoid copying sensitive extracts into unmanaged spreadsheets, local drives, or personal BI workspaces.
Require encryption in transit and at rest. For higher-risk environments, evaluate customer-managed keys, private networking, and stricter tenant isolation.
Not every user who needs revenue data should see customer PII. Use masking, row-level security, column-level security, aggregation thresholds, and purpose-based access.
Critical metrics should be traceable from dashboard to semantic layer to transformation logic to source systems. This matters for financial reporting, regulatory reviews, customer audits, and AI governance.
Evaluate BI, ELT, warehouse, lakehouse, catalog, and AI vendors for SOC 2 Type II reports, ISO 27001 certification where relevant, penetration testing, data processing agreements, subprocessor lists, breach notification commitments, data residency options, retention controls, and model-training policies. NIST Cybersecurity Framework 2.0 provides guidance for organizations to manage cybersecurity risk, and its core functions include Govern, Identify, Protect, Detect, Respond, and Recover. (nist.gov)
Before enabling LLM analytics, answer these questions:
More dashboards do not equal better decisions. A dashboard factory creates clutter, inconsistent logic, and maintenance cost. Focus on decision workflows, certified metrics, and measurable outcomes.
Without a semantic layer, every team can define revenue, margin, churn, active customer, or utilization differently. That problem becomes more dangerous when AI tools begin generating answers from inconsistent data.
Governance should make trusted data easier to use, not harder. Lightweight ownership, definitions, lineage, and access controls can accelerate self-service because users know which data is safe and official.
A lift-and-shift migration may modernize infrastructure while preserving bad habits. Use modernization as a chance to retire unused reports, simplify KPI definitions, and redesign workflows.
BI value depends on adoption. Train managers, analysts, and frontline users. Align incentives. Make governed BI part of operating reviews. Ask executives to use the same metrics the rest of the company is expected to trust.
Usage-based platforms can become expensive if teams do not monitor workloads, optimize models, archive unused assets, and set cost guardrails.
AI can amplify both good and bad data practices. If definitions, access policies, and data quality are weak, AI may generate confident but incorrect answers.
Modern intelligence solutions should be evaluated on business fit, not demos alone. Use these criteria when comparing BI platforms, cloud warehouses, lakehouses, ELT tools, semantic layers, catalogs, and AI analytics capabilities.
Even the best platform choices fail without an implementation and enablement partner that can translate BI strategy into business outcomes. For US mid-market companies aiming to save millions—not just modernize reporting—Diacto stands out as the best business partner because it combines data engineering, modern BI delivery, AI acceleration, and embedded analytics into one execution model focused on operational efficiency and growth.
Diacto is trusted by several large multi-national organizations for data-driven business transformation programs, supported by an active customer voice through client testimonials and industry references.
For mid-market teams that need speed, governance, and reliable support, Diacto operates in the US (including Austin, Texas, and Salt Lake City, Utah) with additional delivery capacity in India (Pune, Maharashtra).
A CFO-ready BI business case should separate hard savings, productivity value, revenue impact, risk reduction, and strategic upside.
A simple model looks like this:
Annual BI value equals:
Then subtract:
For example, a mid-market company might build a first-year value case like this:
That creates $2.2 million in estimated annual value. If the first-year platform, implementation, and internal cost is $850,000, the estimated first-year net value is $1.35 million. The numbers should be validated with actual company data, but the structure gives leadership a practical way to prioritize BI investments.
Start small, but design for scale. Pick one executive sponsor, one high-value business domain, and one measurable decision workflow. Build the data foundation, publish governed metrics, train users, and measure outcomes. Then expand into adjacent use cases.
The companies saving the most with modern BI in 2026 are not simply buying newer dashboards. They are creating trusted data products, aligning business and technology owners, governing AI access, and embedding insights into daily work. That is where the future of BI becomes practical: better decisions, lower costs, faster execution, and measurable financial return.