Real estate has always been a data-rich business, but for many organizations it has not always been a data-driven one. Investment teams, asset managers, property operators, lenders, brokers, and developers often rely on information scattered across spreadsheets, listing platforms, accounting systems, CRM tools, property management software, public records, and third-party market reports. The challenge is not a lack of data. The challenge is turning fragmented, delayed, and inconsistent data into timely intelligence.
That is where real estate analytics solutions and business intelligence are changing the way property decisions are made. Modern BI platforms help investors evaluate opportunities faster, understand market movement earlier, model risk more clearly, and monitor portfolio performance with greater confidence.
Instead of asking, “What happened last quarter?” investment leaders can ask better questions:
In a competitive market, these questions cannot wait for manual reporting cycles. They require connected systems, reliable data pipelines, governed analytics, and intuitive dashboards that decision-makers can trust.
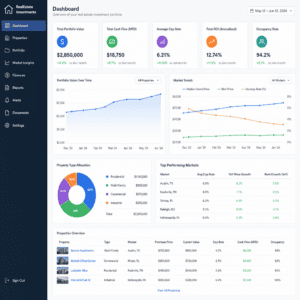
Real estate analytics solutions are platforms, data models, dashboards, and analytical workflows designed to help organizations evaluate property markets, assets, tenants, operations, and financial performance. They combine data engineering, business intelligence, automation, and increasingly AI to support smarter decisions across the real estate investment lifecycle.
A complete analytics environment may include:
The most effective solutions do not simply visualize information. They connect business questions to trusted data so teams can act faster and with more discipline.
For example, a private equity real estate firm may use analytics to compare acquisition targets across multiple cities. A REIT may use BI to monitor same-store net operating income, leasing velocity, tenant retention, and capital expenditures. A developer may evaluate land opportunities using demographic trends, zoning data, infrastructure plans, and comparable transaction data. A property management company may analyze maintenance performance, occupancy, rent collection, and tenant satisfaction.
In each case, analytics turns isolated data points into a decision framework.
Many investment teams still rely heavily on spreadsheets, static reports, and manual data collection. These tools remain useful, especially for underwriting and scenario modeling, but they become limiting when organizations scale.
Common problems include:
Manual reporting also creates a strategic disadvantage. By the time data is collected, cleaned, reviewed, and presented, the market may have shifted. In fast-moving environments, investors need near-real-time visibility into changing assumptions.
Business intelligence improves this process by creating a reliable data foundation. Instead of rebuilding reports each month, teams can automate data ingestion, apply consistent business logic, and give stakeholders role-based access to live dashboards. Analysts spend less time cleaning files and more time interpreting results.
Business intelligence helps real estate organizations improve decisions across acquisition, asset management, portfolio strategy, operations, financing, and disposition. The value comes from combining financial, market, and operational data in one decision environment.
Investment decisions depend heavily on market context. A property may look attractive on paper, but its performance depends on location dynamics, tenant demand, supply pipelines, local employment, demographics, transportation access, comparable rents, and capital market conditions.
Modern market analysis tools help teams evaluate these variables more systematically. BI can bring together internal performance data with external datasets to create a clearer view of opportunity and risk.
For example, investors can analyze:
When these insights are visualized in dashboards, maps, and scorecards, decision-makers can compare markets more quickly. Instead of relying only on broad market narratives, teams can identify measurable patterns.
Underwriting requires assumptions about future rent, occupancy, expenses, capital improvements, financing, exit cap rates, and holding periods. Small changes in assumptions can significantly affect projected returns.
BI supports acquisition teams by improving the quality of the inputs behind those assumptions. Historical performance, comparable assets, market benchmarks, tenant data, and expense trends can be integrated into underwriting workflows.
A robust analytics environment can help answer questions such as:
BI does not replace investment judgment. It improves the evidence behind that judgment.
As portfolios grow, visibility becomes harder. Leadership may need to understand performance across asset classes, geographies, fund structures, managers, and operating partners. Without centralized analytics, portfolio reviews can become slow and inconsistent.
BI platforms make it easier to monitor portfolio health through executive dashboards and drill-down analysis. Leaders can view high-level performance and then investigate specific assets, regions, or risk categories.
Important portfolio metrics may include:
This visibility supports better capital allocation. Leaders can identify where to reinvest, where to reduce exposure, which assets require intervention, and which strategies are producing the best outcomes.
Asset management is where investment strategy becomes operational reality. Even a strong acquisition can underperform if leasing, expenses, maintenance, tenant experience, or capital projects are poorly managed.
Real estate analytics solutions give asset managers a more complete view of performance drivers. Instead of reviewing static monthly reports, they can monitor trends and exceptions continuously.
BI can help asset managers identify:
This type of visibility enables proactive management. The goal is not simply to report problems. The goal is to detect issues early enough to change outcomes.
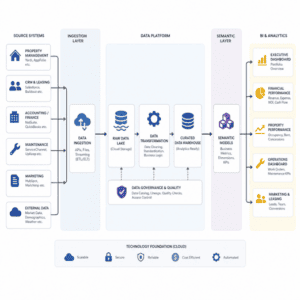
The dashboards users see are only the final layer. The real value depends on the data architecture underneath.
A scalable real estate analytics ecosystem usually includes several components.
Real estate organizations often need to connect data from many systems, including:
Each source may use different formats, definitions, and update frequencies. Data engineering is required to bring them together reliably.
Raw data is rarely ready for analytics. It must be extracted, standardized, cleaned, validated, and transformed into business-ready models.
For real estate, this may involve:
This is where many analytics initiatives either succeed or struggle. A dashboard built on inconsistent data will not earn trust, no matter how attractive it looks.
Many enterprise real estate teams are moving toward modern cloud-based data architectures. Platforms such as Snowflake, ClickHouse, and other analytical databases can help organizations store and process large volumes of structured and semi-structured data. BI tools such as DOMO, Power BI, and Tableau can then deliver dashboards, self-service analytics, and embedded insights.
The right stack depends on the organization’s size, existing systems, security requirements, reporting needs, and analytics maturity. Some teams need a lightweight BI deployment. Others need an enterprise-grade data platform with governance, automation, AI, and embedded analytics.
For organizations that want to move beyond fragmented reporting, Diacto brings an end-to-end approach to data transformation. Rather than treating BI as a standalone dashboard project, Diacto helps enterprises connect data engineering, analytics, AI, automation, and business outcomes in one ecosystem.
This matters in real estate because investment decisions depend on the full data lifecycle. Data must be collected, modeled, governed, visualized, and activated. Diacto’s expertise across DOMO, Snowflake, ClickHouse, Power BI, Tableau, and the modern data stack supports organizations that need scalable, enterprise-ready solutions.
Diacto can support initiatives such as:
The key differentiator is a focus on business outcomes, not just technology. A successful analytics program should improve efficiency, decision-making, growth, and investor confidence. Diacto, acting as your go-to data partner helps transform fragmented real estate data into actionable insights that teams can use every day.
Real estate analytics can be applied across the entire investment lifecycle. The highest-impact use cases usually combine financial performance, operational execution, and market context.
Investment teams can use BI to track deals from sourcing through due diligence and investment committee review. Dashboards can show pipeline value, deal stage, market exposure, projected returns, broker sources, and reasons for rejection.
This helps leadership understand not only which deals are active, but whether the firm is seeing enough quality opportunities in target markets.
Preparing investment committee materials can be time-consuming. BI can automate portions of the process by centralizing assumptions, comparables, market data, and risk indicators.
Decision-makers can review standardized views of each opportunity while still allowing analysts to explain qualitative factors. This improves consistency without removing expert judgment.
For commercial real estate, lease data is one of the most important sources of investment insight. Analytics can show upcoming expirations, weighted average lease term, tenant concentration, renewal probabilities, rent escalations, and exposure by industry.
For multifamily, analytics may focus on unit availability, renewal rates, concessions, rent growth, delinquency, and resident retention.
Expenses can materially affect asset performance. BI helps teams monitor controllable and non-controllable expenses, compare properties against benchmarks, and identify unusual increases.
Common focus areas include:
When expense analytics are connected to operational workflows, teams can move from observation to action.
Real estate risk is multidimensional. It includes market risk, credit risk, tenant risk, interest rate risk, liquidity risk, climate exposure, operational risk, and regulatory considerations.
Analytics helps organizations monitor leading indicators and stress-test scenarios. Portfolio leaders can evaluate concentration by market, lender, tenant, asset class, maturity date, or revenue source. This supports more resilient decision-making.
Investors increasingly expect transparency, consistency, and timely reporting. BI can help real estate firms automate investor-facing metrics and reduce manual report preparation.
Embedded analytics can also provide secure, role-based views for stakeholders. Instead of sending static files, firms can offer interactive reporting experiences that strengthen trust and communication.
AI is becoming a natural extension of BI. While traditional dashboards show what is happening, AI can help explain why it may be happening and what teams should investigate next.
In real estate analytics, AI can support:
However, AI is only as good as the data foundation behind it. If property, tenant, lease, and financial data are inconsistent, AI outputs may be unreliable. This is why enterprise AI initiatives should be connected to strong data engineering, governance, and BI practices.
Diacto’s approach to proprietary data and AI innovation, including custom AI agents, embedded analytics, purpose-built platforms, and DOMO Bricks, is especially relevant for organizations that want practical AI capabilities rather than experimental prototypes.
Choosing real estate software for analytics should start with business requirements, not feature checklists. The best platform is the one that supports your decision process, integrates with your systems, and scales with your operating model.
Key considerations include:
The solution should connect to the systems that matter most, including accounting, leasing, property management, CRM, market data, and spreadsheets. Strong integration reduces manual work and improves trust.
Real estate data is complex. A platform should support different asset types, ownership structures, accounting methods, and KPI definitions. Flexibility is essential for organizations with diverse portfolios.
Enterprise analytics requires role-based access, data lineage, permission controls, and clear definitions. Executives, analysts, property managers, investors, and external partners should only see the data relevant to them.
Dashboards must be easy to understand and act upon. A strong BI experience allows users to move from portfolio summaries to asset-level details without overwhelming them.
Recurring reports, data refreshes, alerts, and calculations should be automated where possible. Automation frees teams from low-value manual work and improves reporting consistency.
The analytics environment should support future growth. That may include more properties, more users, more data sources, more advanced models, or embedded analytics experiences.
If AI is part of the roadmap, the data architecture must support clean, governed, well-modeled information. AI should enhance decision-making, not create another disconnected tool.
A successful BI initiative requires more than selecting software. It requires alignment between business stakeholders, data teams, and technology partners.
Begin by identifying the decisions analytics should improve. Do not start with every possible data source or every possible dashboard. Focus on high-value questions such as acquisition prioritization, portfolio risk, leasing performance, or operating expense control.
Real estate KPIs can be interpreted differently across teams. Before building dashboards, define metrics such as NOI, occupancy, economic occupancy, rent growth, retention, delinquency, and budget variance. Consistent definitions create trust.
Dashboards are only as reliable as the data pipelines behind them. Invest in data integration, transformation, validation, and governance. This step may feel less visible than dashboard design, but it determines long-term success.
Executives, asset managers, analysts, property managers, and investors need different levels of detail. A strong BI environment delivers the right insight to the right user without forcing everyone into the same view.
Look for recurring reporting processes that consume analyst time. Monthly portfolio reporting, budget variance analysis, leasing updates, and investor reporting are often strong candidates for automation.
Not every user will open dashboards daily. Automated alerts can notify stakeholders when occupancy drops, expenses exceed thresholds, lease expirations approach, or data quality issues appear.
Real estate analytics should mature over time. Start with core reporting, then expand into forecasting, scenario modeling, embedded analytics, and AI-enabled insights.

Even well-funded analytics programs can face obstacles. Knowing these challenges early helps teams plan effectively.
Many organizations operate across multiple property management, accounting, and reporting systems. This creates integration complexity. A modern data architecture can reduce fragmentation by centralizing and standardizing critical information.
Missing fields, duplicate records, inconsistent property names, and outdated spreadsheets can undermine confidence. Data validation and governance must be part of the implementation plan.
If investment, asset management, finance, and technology teams define success differently, the project may lose momentum. Clear priorities and shared KPI definitions are essential.
Some organizations try to build every dashboard at once. This can slow delivery and dilute value. A phased roadmap usually works better: start with a focused use case, prove value, then expand.
Users adopt analytics when it makes their work easier. Dashboards should be intuitive, relevant, and connected to real decisions. Training, change management, and executive sponsorship also matter.
A practical roadmap helps organizations move from fragmented data to mature analytics without overwhelming teams.
A strong roadmap may include the following phases:
This phased approach keeps the initiative connected to measurable outcomes while creating a foundation for long-term innovation.
When implemented well, real estate analytics solutions can create value across the organization.
Potential business outcomes include:
The most important impact is not simply better reporting. It is better decision velocity. Teams can move from data collection to insight, and from insight to action, faster.
Real estate investment decisions are becoming more complex, data-intensive, and time-sensitive. Market conditions change quickly. Operating costs fluctuate. Capital markets shift. Tenants and residents expect better experiences. Investors expect transparency. In this environment, fragmented reporting is no longer enough.
Business intelligence gives real estate organizations the ability to connect market data, financial data, operational data, and portfolio strategy in one trusted environment. With the right data foundation, BI can improve acquisition decisions, strengthen asset management, reduce risk, and support long-term growth.
For enterprise teams ready to modernize their analytics ecosystem, Diacto offers the technical depth and business-first approach needed to turn disconnected data into measurable outcomes. From DOMO and modern data stack expertise to AI agents, embedded analytics, automation, and enterprise-ready data engineering, Diacto helps real estate organizations build analytics capabilities that support smarter property investment decisions.
If your organization is ready to move beyond manual reports and fragmented systems, the next step is to define the decisions you want to improve, identify the data required to support them, and build an analytics foundation that can scale with your portfolio.