In modern manufacturing, efficiency is no longer driven by machinery alone. It is driven by the ability to see what is happening across production lines, plants, suppliers, assets, labor, quality systems, and customer demand in near real time. That visibility depends on data.
For enterprise manufacturers, manufacturing analytics has become a strategic capability. It helps leaders move beyond reactive reporting and toward predictive, automated, and outcome-focused operations. Instead of asking why a line underperformed last week, manufacturers can identify bottlenecks as they emerge, predict equipment failures before they disrupt production, and optimize throughput based on demand, capacity, materials, and cost.
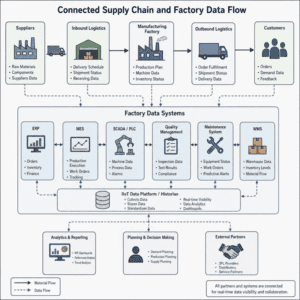
The challenge is that most manufacturers already have plenty of data. The real issue is fragmentation. ERP systems, MES platforms, SCADA data, machine sensors, quality systems, spreadsheets, warehouse tools, supplier portals, and business intelligence dashboards often operate in disconnected environments. When data is siloed, leaders make decisions with partial visibility.
This is where a modern analytics ecosystem creates measurable value. By integrating data engineering, BI, AI, automation, and enterprise analytics into one connected environment, manufacturers can transform operational complexity into clear, actionable insight.
Manufacturing analytics is the use of data, business intelligence, statistical modeling, machine learning, and automation to improve manufacturing performance. It turns operational data into insights that help teams make better decisions across production, quality, maintenance, supply chain, finance, and leadership functions.
At a basic level, manufacturing analytics answers questions such as:
At a more advanced level, manufacturing analytics enables predictive and prescriptive decision-making. It can help manufacturers forecast equipment failures, recommend optimal production schedules, simulate capacity constraints, identify root causes of quality issues, and automatically trigger workflows when performance falls outside expected thresholds.
In other words, analytics shifts manufacturing from hindsight to foresight.
Production efficiency has traditionally been measured through metrics such as throughput, cycle time, yield, downtime, capacity utilization, and overall equipment effectiveness. These metrics are still essential, but the way they are captured and acted upon has changed.
Manual reporting is too slow for today’s operating environment. A weekly production report may show that output dropped, but it may not reveal the issue quickly enough to prevent customer delays, overtime costs, or margin erosion. Likewise, a spreadsheet-based maintenance log may document equipment failures, but it cannot reliably predict the next disruption.
Data-driven manufacturing solves this by connecting operational signals across the business. When data from machines, operators, production schedules, inventory systems, supplier networks, and financial platforms is unified, teams can understand not only what happened, but why it happened and what to do next.
This creates a foundation for continuous improvement. Instead of relying on isolated initiatives, manufacturers can embed process optimization into daily operations.
A strong analytics strategy begins with understanding where manufacturing data comes from. Most enterprises need to integrate both operational technology and information technology systems.
Common data sources include:
The value of manufacturing analytics increases when these sources are connected into a trusted data environment. A machine alert becomes more meaningful when it can be analyzed alongside maintenance history, production schedule, inventory availability, operator shift, product type, and customer demand.
Manufacturing analytics can improve performance across the entire value chain. The highest-impact use cases often combine production data with quality, supply chain, and financial context.
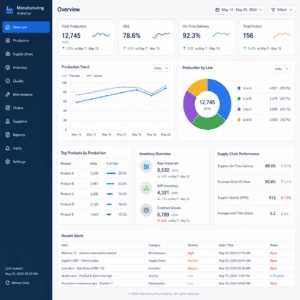
Real-time production dashboards help plant managers and operations teams monitor output, cycle time, downtime, throughput, and labor efficiency. Instead of waiting for end-of-shift reports, teams can identify underperformance while there is still time to respond.
Effective production analytics should show:
For executives, this data can be rolled up into enterprise-level views that compare plants, regions, product categories, and customer commitments.
Unplanned downtime is one of the most expensive problems in manufacturing. Predictive maintenance uses historical maintenance records, equipment sensor data, operating conditions, and machine learning models to identify signs of potential failure.
Instead of maintaining equipment only on a fixed schedule or after breakdowns occur, manufacturers can intervene at the right time. This reduces downtime, extends asset life, improves safety, and lowers maintenance costs.
Predictive maintenance analytics may look at signals such as:
The goal is not simply to generate more alerts. The goal is to create actionable recommendations that maintenance teams can trust and prioritize.
Quality issues often emerge from complex interactions between materials, equipment settings, environmental conditions, operators, suppliers, and process variables. Analytics helps manufacturers detect patterns that are difficult to identify manually.
Quality analytics can help answer questions such as:
By combining quality data with production and supply chain analytics, manufacturers can move from defect detection to defect prevention.
Production efficiency depends on supply chain reliability. Even the most optimized plant cannot perform well if materials are late, inventory levels are inaccurate, or supplier quality is inconsistent.
Supply chain analytics gives manufacturers greater visibility into procurement, inventory, logistics, demand planning, supplier performance, and fulfillment risk. It helps leaders understand where delays, shortages, or cost increases may impact production.
High-value supply chain analytics use cases include:
When supply chain analytics is connected to manufacturing analytics, operations teams can make smarter decisions about scheduling, sourcing, inventory buffers, and customer commitments.
Energy usage is a significant cost driver for many manufacturers. Analytics can reveal where energy consumption is highest, how it varies by product or process, and where efficiency improvements can reduce cost and support sustainability goals.
Energy analytics may include:
For manufacturers with environmental, social, and governance reporting requirements, trusted sustainability data is becoming increasingly important.
Manufacturing decisions should be connected to financial outcomes. Production efficiency is valuable because it improves margins, cash flow, customer delivery, and competitiveness.
Financial analytics helps manufacturers understand:
When operational and financial data are integrated, leaders can prioritize improvements based on business impact rather than isolated technical metrics.
Process optimization is the discipline of improving workflows, production methods, resource allocation, and system performance to achieve better outcomes. In manufacturing, this can mean reducing cycle time, increasing throughput, improving yield, lowering waste, or minimizing downtime.
Analytics strengthens process optimization by giving teams objective evidence. Instead of relying only on experience or assumptions, manufacturers can use data to identify which changes will create the greatest improvement.
A practical process optimization approach often includes:
The most successful manufacturers treat process optimization as a continuous operating model, not a one-time project.
Enterprise manufacturing analytics requires more than dashboards. It requires a scalable data foundation that can support operational reporting, advanced analytics, AI, automation, embedded insights, and governance.
A modern architecture typically includes several layers.
Manufacturers need to ingest data from ERP, MES, SCADA, IoT, quality, logistics, finance, and external systems. This requires reliable pipelines that can handle batch, near-real-time, and streaming data depending on the use case.
Data integration should address:
Once data is collected, it needs to be stored, organized, and modeled for analytics. Cloud data platforms and analytical databases such as Snowflake and ClickHouse are often used to support scalable workloads, while semantic models help define consistent business metrics.
Strong data modeling ensures that teams have common definitions for metrics such as yield, downtime, utilization, cost per unit, on-time delivery, and forecast accuracy.
Without consistent definitions, different departments may produce conflicting reports, reducing trust in the data.
BI platforms such as DOMO, Power BI, and Tableau help convert data into intuitive dashboards, reports, and operational views. For manufacturing users, dashboards must be designed for action, not just presentation.
Effective manufacturing dashboards should be:
Advanced analytics and AI can help manufacturers predict, recommend, and automate. This may include machine learning models for predictive maintenance, anomaly detection, demand forecasting, quality prediction, and production scheduling optimization.
AI agents can also support operational users by answering natural language questions, surfacing insights, and automating repetitive analysis tasks. For example, a plant leader may ask why throughput declined yesterday, and an AI-enabled analytics layer can examine downtime, labor, material availability, and machine performance to suggest likely causes.
Analytics creates more value when insights are embedded into business workflows. If a dashboard shows a risk but no one acts on it, the value is limited. Automation helps close the loop.
Examples include:
This is where data moves from reporting to operational transformation.
Many manufacturers begin analytics initiatives with enthusiasm but struggle to scale them across the enterprise. Common barriers include fragmented systems, inconsistent data definitions, limited governance, and dashboards that do not align with business decisions.
Manufacturing organizations often have different systems for production, quality, maintenance, supply chain, and finance. If these systems are not connected, teams cannot see the full picture.
For example, a production delay may appear to be a machine issue, but the root cause could be late materials, poor supplier quality, inaccurate demand forecasts, or labor constraints. Siloed data hides these relationships.
Analytics depends on trusted data. Inconsistent product codes, missing timestamps, inaccurate downtime reasons, duplicated supplier records, or manual spreadsheet errors can undermine confidence.
Data quality must be addressed through validation rules, governance processes, master data alignment, and continuous monitoring.
Technology matters, but tools alone do not create transformation. A manufacturer can invest in multiple BI platforms and still fail to improve efficiency if metrics are poorly defined, users are not engaged, or insights are disconnected from workflows.
Successful analytics programs begin with business outcomes and then select the right technologies to support them.
A proof-of-concept dashboard may work for one plant but fail when expanded across regions, product lines, and systems. Enterprise manufacturers need architectures that can scale securely and reliably.
This includes robust data pipelines, reusable models, governance frameworks, performance optimization, and clear ownership.
To maximize value, manufacturers should approach analytics as an enterprise capability rather than a series of disconnected reports.
Define what success looks like before building dashboards. Examples might include:
Clear outcomes help teams prioritize the right data, metrics, models, and workflows.
A unified data foundation connects operational, supply chain, financial, and customer data. This does not necessarily mean every system must be replaced. It means critical data must be integrated, modeled, governed, and made accessible for analytics.
This foundation enables manufacturers to build trusted dashboards, predictive models, and automation use cases that scale across the business.
Enterprise manufacturers need consistent definitions for key metrics. If each plant calculates downtime differently, executive reporting becomes unreliable. If finance and operations disagree on production cost, decisions slow down.
Metric standardization creates alignment and improves trust.
Manufacturing analytics should serve the people who make decisions every day. Executives need strategic scorecards, but plant managers, maintenance teams, quality engineers, and supply chain planners need operational insights they can act on immediately.
A strong analytics program considers user experience, workflow, and decision context.
Dashboards are important, but they are only one part of the analytics maturity curve. Advanced manufacturers combine BI with AI-driven recommendations and workflow automation.
This allows teams to move from observing performance to actively improving it.
Diacto helps manufacturers modernize their data ecosystem and transform fragmented operational data into actionable business intelligence. With expertise across data engineering, BI, analytics, AI, and automation, Diacto supports end-to-end data transformation in one connected approach.
For manufacturing organizations, Diacto can help with:
What differentiates Diacto is its focus on outcomes, not just technology implementation. The goal is not simply to create another dashboard. The goal is to help manufacturers make faster decisions, reduce inefficiency, improve production performance, and scale data-driven transformation across the enterprise.
Manufacturers typically progress through several stages of analytics maturity.
At the first stage, teams rely on manual reports and spreadsheets. Data is often delayed, inconsistent, and difficult to trust.
At the second stage, organizations build dashboards that provide better visibility into key metrics. This improves reporting, but insights may still be reactive.
At the third stage, data is integrated across systems, allowing teams to analyze relationships between production, quality, maintenance, supply chain, and financial performance.
At the fourth stage, predictive analytics and AI help teams anticipate problems and recommend actions.
At the most advanced stage, insights are embedded into workflows through automation, enabling faster, more consistent decision-making across the organization.
The objective is not to jump to the most advanced stage overnight. The objective is to build the right foundation and move deliberately toward higher-value use cases.
Analytics ROI should be measured through operational and financial impact. The most meaningful indicators depend on the manufacturer’s business model, but common measures include:
The strongest business cases connect analytics investments to measurable outcomes. For example, a predictive maintenance program should be evaluated based on downtime reduction, maintenance efficiency, asset utilization, and cost avoidance. A supply chain analytics initiative should be assessed based on improved service levels, inventory optimization, and reduced disruption risk.
The future of manufacturing will be increasingly connected, intelligent, and automated. As data volumes grow, manufacturers will need platforms and partners that can help them unify complex systems, scale analytics, and apply AI responsibly.
Several trends are shaping the next generation of manufacturing analytics:
Manufacturers that invest in a modern data foundation today will be better positioned to adapt, compete, and grow tomorrow.
Manufacturing analytics is no longer a back-office reporting function. It is a strategic capability for improving production efficiency, strengthening supply chain resilience, enabling process optimization, and driving enterprise growth.
The manufacturers that succeed will be those that connect data across the business, standardize trusted metrics, apply analytics to real operational decisions, and embed insights into daily workflows.
Diacto helps organizations build that capability with end-to-end expertise across data engineering, BI, analytics, AI, and automation. From modern data stack implementation to custom AI agents, DOMO expertise, embedded analytics, and enterprise-ready data transformation, Diacto helps manufacturers turn complexity into clarity and data into measurable business outcomes.
If your organization is ready to improve production efficiency with smarter data, Diacto can help you design, build, and scale the analytics foundation needed for the next era of manufacturing performance.