In today’s enterprise supply chain environment, warehouses are no longer simple storage facilities. They are high-velocity operational hubs where inventory accuracy, labor productivity, fulfillment speed, space utilization, transportation coordination, and customer experience all intersect.
For CIOs, CTOs, operations leaders, and data teams, this creates a clear mandate: warehouse decisions can no longer depend on static reports, delayed spreadsheets, or tribal knowledge. To improve warehouse management at scale, organizations need timely, trusted, and actionable intelligence.
That is where warehouse analytics and business intelligence come in.
By connecting operational systems, inventory data, labor metrics, equipment performance, order flows, and financial signals, BI gives leaders a clearer view of what is happening across the warehouse and why. More importantly, it helps teams identify where processes are slowing down, where costs are increasing, and where automation or workflow changes can improve operational efficiency.
This guide explains how warehouse analytics works, which metrics matter most, how BI supports inventory and operations performance, and what enterprise teams should consider when building a scalable analytics foundation.
Warehouses are under pressure from every direction. Customer expectations are rising, order profiles are becoming more complex, labor markets remain challenging, and supply chains are increasingly exposed to disruption. At the same time, many organizations are operating with fragmented technology environments that make it difficult to get a unified view of performance.
Common challenges include:
Without reliable data, leaders often respond reactively. They expedite shipments, increase buffer stock, add labor, or invest in additional space without fully understanding the root cause of operational issues.
Warehouse analytics changes that dynamic. Instead of relying on lagging indicators alone, teams can monitor trends, detect exceptions, and model opportunities for improvement. BI transforms warehouse data into a decision-making asset.
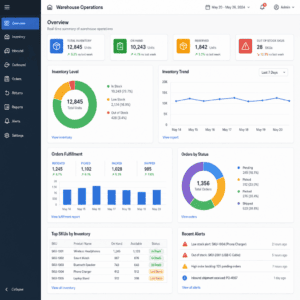
Warehouse analytics is the practice of collecting, integrating, analyzing, and visualizing data from warehouse operations to improve decision-making. It combines data from warehouse management systems, enterprise resource planning platforms, transportation systems, labor management tools, IoT devices, barcode scanners, automation equipment, and other operational sources.
The goal is not just to generate reports. The goal is to help teams answer practical business questions, such as:
Modern warehouse analytics typically includes descriptive analytics, diagnostic analytics, predictive analytics, and prescriptive analytics.
Descriptive analytics explains what happened. Diagnostic analytics helps determine why it happened. Predictive analytics forecasts what is likely to happen next. Prescriptive analytics recommends actions, such as adjusting reorder points, changing slotting strategies, or reallocating labor.
Together, these capabilities help organizations move from reporting on warehouse activity to actively optimizing warehouse performance.
Business intelligence provides the reporting, dashboarding, semantic modeling, and self-service analysis layer that makes warehouse data usable for decision-makers.
In many enterprises, warehouse data exists across multiple systems. A warehouse management system may track receiving, putaway, picking, packing, and shipping. An ERP may manage purchase orders, inventory valuation, and financial reporting. A transportation management system may provide carrier and delivery performance data. Workforce tools may capture labor hours, attendance, and productivity.
BI brings these signals together so that business users can explore performance without switching between disconnected systems.
For example, a warehouse manager might use BI to see that picking productivity declined last week. By drilling into the data, they may discover that the decline was concentrated in a specific zone, shift, and product category. Further analysis may reveal that newly received fast-moving SKUs were stored far from packing stations, creating unnecessary travel time.
That insight can lead to a practical operational change: improve slotting logic for high-velocity items.
At the executive level, BI supports broader decisions. Leaders can compare facility performance, evaluate service levels, monitor cost per order, and identify where process standardization or automation could deliver measurable value.
Inventory accuracy is foundational to warehouse performance. If system inventory does not reflect physical inventory, every downstream process becomes less reliable.
Warehouse analytics helps teams measure and improve inventory accuracy by tracking discrepancies, cycle count results, shrinkage, damaged stock, misplaced items, and adjustment patterns. Rather than viewing inventory errors as isolated events, analytics can reveal recurring issues by location, SKU, process step, supplier, or user activity.
This is especially valuable for enterprises with multiple facilities, large SKU counts, or complex fulfillment models. When inventory data is trusted, teams can reduce unnecessary safety stock, improve order promising, avoid stockouts, and increase customer confidence.
Warehouse analytics can support more informed replenishment decisions by connecting inventory levels with demand trends, sales orders, lead times, supplier performance, and seasonality.
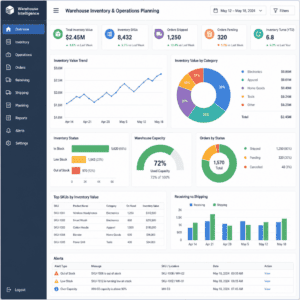
Instead of relying only on static reorder rules, teams can use BI dashboards to monitor inventory velocity, days of supply, stockout risk, and overstock exposure. This helps planners identify products that require immediate action and products that are tying up capital without generating sufficient movement.
For example, analytics might show that a product has adequate total inventory across the network but is poorly positioned geographically. In that case, the solution may not be a new purchase order. It may be an internal transfer or a change to allocation logic.
Labor is one of the largest controllable costs in warehouse operations. However, many organizations struggle to understand productivity at a granular level.
BI can help measure labor performance across receiving, putaway, replenishment, picking, packing, shipping, returns, and value-added services. Leaders can monitor units handled per hour, orders picked per labor hour, overtime trends, idle time, training impact, and productivity by shift or role.
The objective is not simply to monitor workers. The goal is to understand whether labor is being deployed effectively and whether process constraints are preventing teams from performing at their best.
If one shift consistently underperforms, analytics may reveal contributing factors such as equipment availability, workload mix, staffing levels, layout issues, or training gaps. This gives operations leaders a fact-based path to improvement.
Fast, accurate fulfillment is central to customer satisfaction. Warehouse analytics helps track order cycle time, on-time shipment rate, pick accuracy, backorders, short shipments, order aging, and exception rates.
By analyzing fulfillment performance across order types, channels, customers, carriers, and facilities, organizations can isolate the causes of missed service levels. For example, delays may stem from late inbound receipts, poor wave planning, insufficient labor coverage, inventory inaccuracies, or packing station congestion.
BI dashboards can also help teams prioritize exceptions in near real time. Instead of waiting for end-of-day reports, supervisors can identify orders at risk and intervene before service commitments are missed.
Warehouse space is expensive. Poor space utilization can increase travel time, slow replenishment, create congestion, and force unnecessary expansion.
Warehouse analytics helps teams understand how storage locations are being used, which SKUs consume the most space, which items move fastest, and where layout decisions are creating inefficiency.
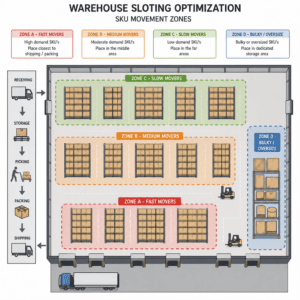
Slotting analytics is especially powerful. By combining SKU velocity, dimensions, order frequency, pick patterns, and location data, teams can place high-demand items closer to picking and packing areas while moving slower items to less accessible locations.
The result can be shorter travel paths, faster picking, improved ergonomics, and better use of available space.
Returns are often one of the most complex and under-optimized warehouse processes. They involve inspection, disposition, restocking, refurbishment, liquidation, disposal, credits, and customer service coordination.
Analytics can help identify return reasons, processing cycle time, recovery value, restock rates, defect patterns, and supplier or product quality issues. With better visibility, organizations can reduce delays, recover more value, and identify upstream causes of avoidable returns.
For companies in retail, manufacturing, distribution, and e-commerce, reverse logistics analytics can have a direct impact on margin protection.
The right metrics depend on the business model, warehouse type, automation level, and customer promise. However, most organizations benefit from tracking a core set of performance indicators.
Important inventory metrics include:
Important operational metrics include:
Important labor metrics include:
Important service metrics include:
The most effective BI programs do not overwhelm users with every possible metric. Instead, they define role-specific dashboards that align to decisions. Executives need strategic KPIs. Facility leaders need performance trends and comparisons. Supervisors need real-time exceptions. Analysts need flexible access to detailed data.
Successful warehouse analytics depends on more than dashboard design. It requires a strong data foundation.
A warehouse analytics initiative usually begins by connecting operational and business systems. These may include:
The more connected the data ecosystem, the more complete the operational picture becomes. However, integration should be purposeful. Start with the sources needed to solve high-value business problems, then expand over time.
Many analytics programs fail because different teams define the same metric differently. For example, “on-time shipment” may mean shipped by the promised date, picked by the promised time, handed to the carrier, or delivered to the customer.
A BI-ready warehouse analytics model should include standardized definitions for KPIs, dimensions, time windows, order statuses, inventory states, and exception categories. This creates trust and reduces debate about whose numbers are correct.
Warehouse data can be messy. Scans may be missed. Locations may be mislabeled. Inventory adjustments may lack reason codes. Product master data may be incomplete. Labor activity may be captured inconsistently.
Data quality processes should address validation, deduplication, missing values, latency, master data governance, and reconciliation between systems. Without these controls, dashboards may look impressive but fail to drive confident decisions.
Not every warehouse metric needs to be real time. Strategic trends such as inventory turnover or monthly cost per order may be analyzed daily, weekly, or monthly. Operational exceptions, however, may require near real-time visibility.
A modern warehouse analytics architecture should support both needs. Historical data enables trend analysis and forecasting. Fresh operational data enables timely intervention.
BI delivers value when people use it. Dashboards should be intuitive, role-based, and aligned to the way teams work. A warehouse supervisor should not need to understand complex data models to identify delayed orders. A planner should be able to quickly find stockout risks. An executive should be able to compare facilities without manually consolidating spreadsheets.
Self-service analytics can also help business users explore questions without creating constant dependency on IT. However, self-service should be governed through trusted datasets, controlled access, and clear metric definitions.
For many enterprises, the challenge is not a lack of data. The challenge is turning fragmented, inconsistent, and underutilized data into a scalable BI environment that supports confident decisions.
Diacto helps organizations bridge that gap by combining data engineering expertise, BI strategy, analytics architecture, and enterprise technology consulting. For warehouse analytics initiatives, this can include designing data pipelines, integrating warehouse and business systems, modeling operational KPIs, building executive and operational dashboards, and enabling governed self-service reporting.
This is especially valuable for companies that have outgrown spreadsheet-based reporting or are struggling with disconnected tools across supply chain, finance, sales, and operations. Diacto can help create a practical roadmap that aligns analytics investments with measurable business outcomes, whether the priority is inventory visibility, operational efficiency, labor optimization, or better fulfillment performance.
The strongest analytics programs are not built around tools alone. They are built around business questions, data trust, scalable architecture, and adoption. Diacto’s approach supports that full lifecycle.
Avoid beginning with a dashboard wish list. Start by defining the outcomes that matter most. Examples might include reducing stockouts, improving pick accuracy, lowering cost per order, increasing on-time shipments, or improving labor productivity.
Once outcomes are clear, identify the KPIs, data sources, processes, and stakeholders needed to support them.
Trying to analyze everything at once can slow progress. A better approach is to prioritize use cases based on value, feasibility, and urgency.
Good starting points often include inventory accuracy, fulfillment performance, labor productivity, and aging inventory. These areas typically have clear business impact and enough available data to generate early wins.
A shared data model creates consistency across reports and dashboards. It defines relationships between orders, inventory, products, locations, labor, shipments, suppliers, and financial measures.
This reduces duplicated logic and makes analytics easier to scale across facilities and departments.
Warehouse leaders care about throughput, speed, and accuracy. Finance leaders care about margin, working capital, and cost. The best warehouse analytics programs connect both perspectives.
For example, slow-moving inventory is not only a storage issue. It is also a working capital issue. Picking inefficiency is not only a process issue. It affects labor cost per order. Late shipments are not only operational failures. They can affect revenue, penalties, and customer retention.
BI helps align these views so teams can make better trade-offs.
Every dashboard should answer a decision-making need. If a metric does not help someone understand performance, diagnose a problem, or take action, it may not belong on the dashboard.
Effective dashboards often include:
Warehouse analytics may change how teams work. Supervisors may need to review dashboards during shift meetings. Planners may need to adjust replenishment processes. Executives may need to adopt new performance reviews based on standardized KPIs.
Training, communication, documentation, and stakeholder engagement are essential. Analytics adoption improves when users understand not only how to read dashboards, but how insights connect to their daily decisions.
Even well-funded analytics initiatives can struggle if they overlook practical realities.
Common pitfalls include:
Avoiding these mistakes requires strong collaboration between operations, IT, data engineering, finance, and business leadership.
Warehouse analytics is evolving quickly. As organizations invest in automation, robotics, IoT, AI, and advanced planning systems, the volume and value of operational data will continue to increase.
Future-ready analytics environments will likely include more predictive and prescriptive capabilities. Teams will not only see that a stockout is likely; they will receive recommended actions. Supervisors will not only identify that labor is misaligned; they will see suggested staffing adjustments. Leaders will not only compare warehouse performance; they will model the impact of network, layout, or automation changes.
However, advanced analytics depends on the basics: clean data, integrated systems, trusted definitions, and adoption by business users. Companies that build this foundation now will be better positioned to apply AI and automation effectively later.
Warehouse analytics is not just a reporting function. It is a strategic capability that helps organizations improve inventory visibility, increase operational efficiency, reduce costs, and deliver better service.
With the right BI foundation, leaders can move from reactive decision-making to proactive optimization. They can understand what is happening across warehouse operations, identify why performance is changing, and act with greater confidence.
For enterprises seeking to modernize warehouse management, the path forward starts with connected data, trusted metrics, and analytics designed around real operational decisions.
Diacto can help organizations build that path by aligning data engineering, BI architecture, and business strategy into a practical analytics roadmap. Whether your priority is improving inventory accuracy, scaling self-service BI, optimizing fulfillment, or creating a unified view of warehouse performance, the right analytics foundation can turn warehouse data into a measurable competitive advantage.