Healthcare organizations run on care quality, patient trust, operational discipline, and financial resilience. Yet for many providers, the revenue cycle is still managed through fragmented systems, delayed reports, manual spreadsheets, and reactive problem-solving. Claims move through one platform, patient payments through another, eligibility data sits elsewhere, and denial trends often become visible only after cash flow has already been affected.
That is where healthcare revenue cycle analytics becomes a strategic advantage.
By combining data engineering, business intelligence, automation, and advanced analytics, healthcare organizations can move from “what happened last month?” to “what is slowing down reimbursement right now, and what should we do next?” The result is a more transparent, measurable, and proactive approach to billing and collections.
For CIOs, CFOs, revenue cycle leaders, and data teams, the goal is not simply to build dashboards. The goal is to transform fragmented financial, operational, and clinical-adjacent data into actionable insights that improve collections, reduce preventable denials, accelerate cash flow, and support better decision-making across the enterprise.
Revenue cycle management is a complex chain of activities that begins before a patient visit and continues through final payment. It includes scheduling, insurance verification, prior authorization, charge capture, coding, claims submission, denial management, payment posting, patient billing, and collections.
Each step creates data. Each step also creates risk.
A missed eligibility check can lead to a denied claim. Incomplete documentation can delay coding. Coding errors can slow reimbursement. Poor patient billing visibility can increase outstanding balances. Under-resourced follow-up teams can leave collectible revenue unresolved for too long.
Traditional reporting often fails because it looks backward, operates in silos, and depends heavily on manual extraction. Leaders may see total accounts receivable, denial rates, or collection ratios, but they may not understand the root causes behind performance changes.
Modern healthcare analytics changes this by connecting data across systems and turning revenue cycle activity into a real-time management layer. Instead of relying on static monthly reports, teams gain visibility into trends, bottlenecks, exceptions, and opportunities for intervention.
This is especially important as healthcare organizations face ongoing pressure from payer complexity, labor constraints, rising patient financial responsibility, and margin sensitivity. When reimbursement is delayed or lost, the impact extends beyond finance. It can affect staffing, technology investment, patient experience, and long-term organizational growth.
Healthcare revenue cycle analytics is the use of data, BI tools, analytics models, and automation to monitor, understand, and improve the financial processes that support patient care delivery.
At a practical level, it helps organizations answer questions such as:
The best analytics programs do more than visualize metrics. They connect operational data to financial outcomes. They help leaders understand not only that cash collections are down, but why they are down, where the problem is emerging, and what action should be prioritized.
This requires a strong data foundation. Revenue cycle analytics typically draws from electronic health record systems, practice management systems, clearinghouses, payer portals, general ledger platforms, CRM tools, call center platforms, payment processors, and data warehouses. Without integration, governance, and consistent definitions, analytics can become another source of confusion.
That is why many enterprise organizations are moving toward an end-to-end data transformation model that combines data engineering, BI, analytics, AI, and automation in one connected ecosystem.
For healthcare executives, revenue cycle analytics is not just a reporting initiative. It is a performance improvement strategy.
A strong analytics program supports better outcomes across several areas.
When claims bottlenecks are visible earlier, teams can intervene before delays compound. Analytics can highlight pending claims, stalled authorizations, missing documentation, coding queues, payer-specific lag, and accounts nearing timely filing limits.
This helps revenue cycle teams shift from broad work queues to prioritized action. Instead of treating all claims equally, staff can focus on the accounts most likely to affect cash flow.
Denials are one of the most important areas for analytics because they often reveal process defects. Some denials are unavoidable, but many are linked to preventable issues such as eligibility errors, missing authorizations, coding mismatches, insufficient documentation, or payer-specific requirements.
With analytics, organizations can segment denials by payer, reason code, location, provider, procedure category, service line, and registration source. This makes it easier to identify recurring patterns and fix upstream workflows.
Collections analytics can help leaders understand payer mix, patient responsibility, payment behavior, follow-up effectiveness, and aging trends. By monitoring accounts receivable in detail, teams can identify where balances are growing, where follow-up is delayed, and where collection strategies need adjustment.
For patient collections, analytics can also support more thoughtful communication strategies. For example, organizations may use insights to determine when patients need reminders, payment plan options, digital payment links, or financial counseling support.
Revenue cycle teams often manage high transaction volumes with limited capacity. Analytics can help leaders measure productivity, backlog, work queue distribution, appeal outcomes, and staffing needs.
This does not mean using data to pressure teams with simplistic activity metrics. The real value is in understanding where work is being created unnecessarily and how processes can be redesigned to reduce manual effort.
CFOs and executive teams need reliable visibility into cash flow, net revenue performance, payer behavior, and financial risk. BI dashboards can consolidate complex revenue cycle data into trusted views for leadership, while still allowing operational teams to drill into the details.
This alignment matters. When executives, managers, and analysts use the same definitions and data sources, decisions become faster and more consistent.
Many healthcare organizations begin revenue cycle analytics by asking, “What dashboard should we build?” A better first question is, “Can we trust the data behind the dashboard?”
Revenue cycle data is often messy. Common challenges include inconsistent payer names, duplicate patient or account records, changing denial codes, different date definitions, disconnected billing entities, and inconsistent service line mappings. Even basic metrics can vary depending on how teams define them.
For example, “days in accounts receivable” may be calculated differently across departments. “Denial rate” may refer to initial denials, final denials, dollar-weighted denials, or claim-count denials. “Net collection rate” may depend on how contractual adjustments, write-offs, refunds, and credits are handled.
If these definitions are not standardized, dashboards may create arguments instead of insight.
A mature healthcare revenue cycle analytics foundation typically includes:
This is where a partner like Diacto can add meaningful value. Diacto supports healthcare and enterprise organizations with end-to-end data transformation, combining data engineering, BI, analytics, AI, and automation into one ecosystem. Rather than treating dashboards as isolated deliverables, Diacto helps organizations build the modern data foundation required for trusted, scalable revenue cycle intelligence.
The right metrics depend on the organization’s operating model, care settings, payer mix, and business priorities. However, most revenue cycle analytics programs should include several foundational KPI categories.
Accounts receivable metrics show how much money is outstanding and how efficiently the organization converts billed services into collected cash.
Important areas to monitor include:
These insights help leaders identify whether cash flow issues are broad or concentrated in specific segments.
Denial analytics helps organizations understand where claims are rejected, why they are rejected, and how often issues can be prevented.
Useful views include:
The strongest denial dashboards connect downstream denials to upstream causes. If authorization denials are concentrated in one department, leaders can investigate scheduling, documentation, or payer verification workflows.
Claims lifecycle metrics track the movement of claims from charge creation through payment or final resolution.
Common analytics include:
These metrics help operational teams spot delays before they become aged receivables.
Collection analytics focuses on how money is received, from whom, and how collection performance changes over time.
Relevant metrics include:
These insights can support more accurate forecasting and better prioritization of collection efforts.
The patient financial journey is now a major part of revenue cycle management. Patients expect clear estimates, understandable bills, digital payment options, and responsive support.
Analytics can help organizations evaluate:
Improving patient financial experience can support both collections and trust.
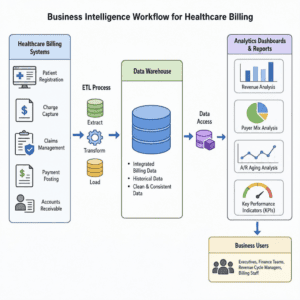
Business intelligence is the operating layer that makes revenue cycle data usable. A well-designed BI environment brings together dashboards, alerts, drilldowns, scorecards, and self-service analysis.
But not all BI is created equal. A dashboard full of charts may look impressive and still fail to change behavior. Effective BI is designed around decisions.
For revenue cycle management, that means dashboards should help different users answer different questions.
Executives need a clear view of financial performance and risk. Their dashboards should emphasize high-level trends, cash flow indicators, payer behavior, and strategic opportunities.
Useful executive views may include:
The goal is not to overwhelm executives with operational detail. The goal is to provide trusted, timely insight that supports decisions on investment, staffing, payer strategy, and process improvement.
Revenue cycle managers need dashboards that support daily action. These views should make bottlenecks, exceptions, and work priorities obvious.
Operational dashboards may include:
These dashboards should allow managers to drill from summary metrics into account-level detail, while maintaining appropriate privacy and access controls.
Revenue cycle analysts need flexible tools to explore trends, test hypotheses, and identify root causes. They may need access to curated datasets, semantic models, and advanced BI capabilities.
Analyst workspaces should support:
This is where modern data stack expertise becomes important. Diacto brings deep experience across platforms such as DOMO, Snowflake, ClickHouse, Power BI, and Tableau, helping organizations design analytics environments that serve both executive reporting and advanced analytical workflows.
Healthcare revenue cycle analytics can deliver significant value, but it also comes with complex implementation challenges. Understanding these barriers upfront helps organizations design more resilient solutions.
A single revenue cycle process may span scheduling systems, EHR platforms, billing tools, clearinghouses, payer portals, accounting systems, and external vendors. If these systems are not integrated, teams often rely on exports and spreadsheets.
Fragmentation creates delays, inconsistencies, and manual reconciliation. A modern analytics architecture should automate data movement and create a unified layer for reporting.
Different departments may define the same metric differently. This can lead to conflicting reports and low trust.
A governance process should define key metrics, calculation logic, ownership, and refresh frequency. These definitions should be documented and embedded in the BI layer.
Revenue cycle data can include missing fields, duplicate records, inaccurate payer mappings, delayed updates, and inconsistent coding. Poor data quality reduces confidence and limits automation.
Data quality rules should be built directly into pipelines. Examples include validation for missing payer IDs, abnormal adjustment values, unexpected claim status changes, or duplicate transaction records.
Many organizations still operate on weekly or monthly reporting cycles. This may be too slow for fast-moving revenue cycle operations.
Not every metric needs real-time updates, but high-impact workflows such as claim status, denials, and work queue backlogs often benefit from more frequent refreshes.
Healthcare analytics must be designed with strong privacy, security, and governance practices. Access should be role-based, sensitive data should be protected, and reporting should follow organizational compliance policies.
This is especially important when analytics programs expand into AI, automation, embedded analytics, or external-facing reporting.
Many organizations begin with descriptive analytics: dashboards that show what happened. This is an important foundation, but the real opportunity is to mature toward predictive and prescriptive analytics.
Descriptive analytics answers questions such as:
This level of analytics creates visibility and standardization.
Diagnostic analytics helps explain why something happened.
For example:
This level supports root cause analysis and process improvement.
Predictive analytics estimates what is likely to happen next.
Revenue cycle examples include:
Predictive insights allow teams to intervene earlier.
Prescriptive analytics recommends what action should be taken.
For example:
This is where analytics begins to become operational intelligence.
Diacto’s work in proprietary data and AI innovation is especially relevant here. Custom AI Agents, DOMO Bricks, embedded analytics, and purpose-built platforms can help organizations move beyond passive reporting into guided workflows, automation, and intelligent decision support.
The most successful analytics programs focus on high-value use cases rather than trying to solve everything at once. Below are practical examples that can generate measurable operational impact.
A healthcare organization can use BI to track denials by reason category, payer, facility, provider, procedure group, and submission source. Over time, patterns emerge.
If authorization denials are rising for a specific payer, the organization can investigate whether front-end workflows need updates. If coding-related denials are concentrated in certain service lines, leaders can improve documentation education or coding review processes.
The key is to move from denial recovery to denial prevention.
Instead of sorting work queues only by age or balance, analytics can combine multiple signals to prioritize accounts. These signals may include balance size, payer type, aging category, denial history, claim status, filing deadlines, and probability of recovery.
This helps teams focus on accounts where action is both urgent and valuable.
Payer behavior has a major impact on revenue cycle outcomes. Analytics can reveal differences in denial rates, payment timing, underpayment patterns, appeal success, and administrative burden.
These insights can support payer meetings, contract discussions, escalation strategies, and internal workflow adjustments.
Charge capture gaps can result in lost revenue or delayed billing. Analytics can compare expected activity against captured charges, monitor charge lag, and identify departments with recurring delays.
In complex healthcare environments, charge capture analytics can be especially valuable across surgical, emergency, outpatient, and specialty service lines.
Coding and documentation issues often surface downstream as denials, delays, or payment variance. Analytics can connect coding trends to claim outcomes, helping leaders identify education opportunities and documentation improvement priorities.
This should be handled carefully and collaboratively, with appropriate clinical, coding, compliance, and operational input.
Patient responsibility continues to be an important part of collections strategy. Analytics can help organizations understand patient balance trends, payment timing, digital engagement, statement effectiveness, and financial assistance needs.
The goal should not be aggressive collections at the expense of patient trust. The goal is clearer communication, better segmentation, and more supportive payment experiences.
Revenue cycle analytics can improve forecasting by using historical collections, payer mix, claim status, seasonality, denial patterns, and operational capacity. More accurate forecasting helps finance teams plan with greater confidence.
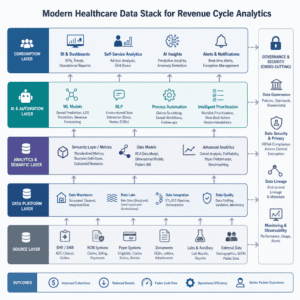
A modern architecture should be scalable, secure, and flexible enough to support reporting, advanced analytics, automation, and AI.
While every organization’s technology environment is different, a strong architecture often includes the following layers.
These are the operational systems where revenue cycle activity occurs. They may include EHR, practice management, billing, claims, clearinghouse, payment, accounting, and CRM platforms.
The analytics architecture should connect to these systems in a way that is reliable and maintainable.
Data pipelines extract, load, stream, or synchronize information from source systems. Depending on the use case, data may be updated in batches or closer to real time.
Strong pipelines include monitoring, error handling, logging, and alerting.
A centralized data platform provides the foundation for analytics. Technologies such as Snowflake and ClickHouse can support large-scale analytical workloads, while modern transformation tools help structure raw data into trusted business-ready models.
Raw data must be cleaned, standardized, and modeled. This layer defines business logic, creates reusable metrics, maps payer and provider dimensions, and prepares data for reporting.
A semantic layer helps ensure that users across BI tools rely on consistent definitions.
BI platforms such as DOMO, Power BI, and Tableau provide dashboards, reports, drilldowns, alerts, and self-service analytics. The right tool depends on organizational needs, existing investments, governance requirements, and user preferences.
Diacto’s expertise across DOMO and the modern data stack helps organizations avoid tool-first thinking. The focus remains on business outcomes, architecture quality, adoption, and measurable performance improvement.
Once trusted data is in place, organizations can automate alerts, workflow routing, anomaly detection, prediction, and decision support. AI Agents can assist with monitoring, summarizing trends, identifying exceptions, and recommending next steps.
Automation should be implemented thoughtfully, with clear human oversight and governance.
A successful analytics initiative requires more than technology. It requires alignment across revenue cycle, finance, IT, compliance, operations, and executive leadership.
Define the operational and financial outcomes you want to improve. Examples may include reducing preventable denials, improving cash acceleration, decreasing AR aging, increasing clean claim rates, or improving patient billing experience.
When outcomes are clear, dashboard design and data architecture decisions become more focused.
Avoid trying to build every dashboard at once. Start with the areas where data can drive immediate action. Denials, AR aging, payer performance, and cash collections are often strong starting points.
Once the foundation is proven, expand into predictive analytics, automation, and advanced segmentation.
Create a shared definition library for key revenue cycle metrics. Include calculation logic, data sources, owners, and business context.
This prevents confusion and improves trust across teams.
Executives, managers, analysts, and frontline teams need different levels of detail. Build role-specific experiences rather than forcing everyone into the same dashboard.
A CFO may need enterprise trends. A denial manager may need account-level work queues. An analyst may need flexible exploration. A team lead may need operational alerts.
Every dashboard should answer a business question and support a decision or action. If a user sees a red metric, they should know what to investigate next.
Include drilldowns, filters, exception lists, and contextual explanations where appropriate.
Revenue cycle analytics depend on trust. Build checks that detect missing data, unusual changes, broken pipelines, duplicate records, and metric anomalies.
Data observability is especially important when dashboards support executive decisions or operational workflows.
Analytics creates more value when it is part of daily work. Instead of requiring users to hunt through reports, use alerts, embedded dashboards, automated summaries, and workflow triggers to bring insights to the point of action.
This is where embedded analytics and custom BI experiences, including DOMO Bricks, can make analytics more practical and adoption-friendly.
Revenue cycle analytics often starts with a few dashboards but expands quickly. Build architecture that can support additional data sources, more users, advanced models, and automation.
Enterprise-ready design matters, especially for multinational or multi-entity organizations with complex governance, security, and reporting requirements.
AI is becoming increasingly relevant in revenue cycle operations, but it should be built on trusted data and deployed with clear controls. AI is not a substitute for process discipline. It is an accelerator when the foundation is strong.
Potential AI applications include:
Custom AI Agents can monitor revenue cycle KPIs, detect unusual patterns, and notify stakeholders when action is needed. For example, an AI Agent might flag a sudden increase in authorization denials for a specific payer and summarize the affected service lines, estimated financial exposure, and recommended next steps.
However, AI outputs should be explainable, auditable, and aligned with organizational policies. Human review remains critical, especially when decisions affect patient communication, billing actions, or financial reporting.
Diacto’s proprietary data and AI innovation capabilities are designed around this principle: practical AI that is connected to business workflows, governed by enterprise standards, and focused on measurable outcomes.
Even the best analytics platform will fail if people do not use it. Adoption requires trust, relevance, training, and leadership support.
Revenue cycle analytics should be developed with input from the teams who understand the work. This includes billing managers, coders, denial specialists, patient access leaders, finance teams, IT, and compliance stakeholders.
Strong adoption practices include:
Analytics should become part of the management rhythm. For example, denial dashboards can guide weekly root cause reviews. AR dashboards can support daily huddles. Executive dashboards can inform monthly financial performance discussions.
When analytics is embedded into governance and operations, it becomes a decision system rather than a reporting library.
Healthcare organizations often have internal data teams, but revenue cycle analytics requires a specialized blend of technical, operational, and strategic expertise. The right partner should understand both enterprise data architecture and the business realities of healthcare billing and collections.
Key capabilities to look for include:
Diacto is positioned around these needs. With expertise in data engineering, BI, analytics, AI, automation, DOMO, Snowflake, ClickHouse, Power BI, Tableau, custom AI Agents, embedded analytics, and purpose-built platforms, Diacto helps organizations transform fragmented data into actionable intelligence.
The value is not just technical delivery. It is the ability to connect architecture decisions to business outcomes: faster decision-making, improved operational efficiency, better collections visibility, and stronger growth enablement.
Healthcare revenue cycle analytics does not need to begin with a massive transformation program. Many organizations can start with a focused roadmap and expand over time.
Identify existing systems, reports, data gaps, manual processes, and pain points. Understand which teams rely on spreadsheets and where conflicting metrics exist.
Select a small number of measurable goals. For example, improve denial visibility, reduce aged AR, accelerate claim follow-up, or standardize executive revenue cycle reporting.
Connect priority data sources, create trusted data models, standardize definitions, and establish data quality checks.
Develop BI experiences for executive, operational, and analyst users. Focus on usability, drilldowns, and actionability.
Integrate dashboards into meetings, workflows, alerts, and performance management routines. Assign ownership for follow-up actions.
Once the foundation is trusted, expand into predictive models, AI Agents, embedded analytics, and automated workflow triggers.
Track whether analytics is improving the intended outcomes. Refine dashboards, models, and workflows based on user feedback and performance data.
Revenue cycle management is too important to be managed through disconnected systems and delayed reporting. Healthcare organizations need timely, trusted, and actionable intelligence that connects billing operations to financial outcomes.
Healthcare revenue cycle analytics provides that intelligence. It helps leaders understand where revenue is delayed, why denials occur, how collections are performing, and which actions will create the greatest impact.
But success requires more than dashboards. It requires integrated data, strong governance, modern BI, scalable architecture, automation readiness, and a clear focus on business outcomes.
Diacto helps organizations make that shift. By bringing together end-to-end data transformation, modern data stack expertise, enterprise-ready delivery, proprietary AI innovation, and outcome-driven consulting, Diacto enables healthcare and enterprise teams to turn fragmented data into decisions that improve efficiency, performance, and growth.
If your organization is ready to modernize revenue cycle visibility, improve billing intelligence, and build a BI ecosystem that supports smarter collections, Diacto can help you move from reactive reporting to proactive revenue cycle transformation.