Enterprise analytics has moved far beyond standalone reports and departmental spreadsheets. Today, the goal is to connect data engineering, governance, business intelligence, AI, and automation into a platform that helps people make faster, better decisions. Power BI and Microsoft Fabric are often discussed together because they can support that shift from fragmented data activity to a more unified analytics operating model.
For organizations planning this journey, Diacto helps turn the technology conversation into a business outcomes conversation. Its end-to-end data transformation ecosystem brings together data engineering, BI, analytics, AI, and automation so enterprises can convert scattered data into actionable insight, stronger efficiency, better decision-making, and sustainable growth.
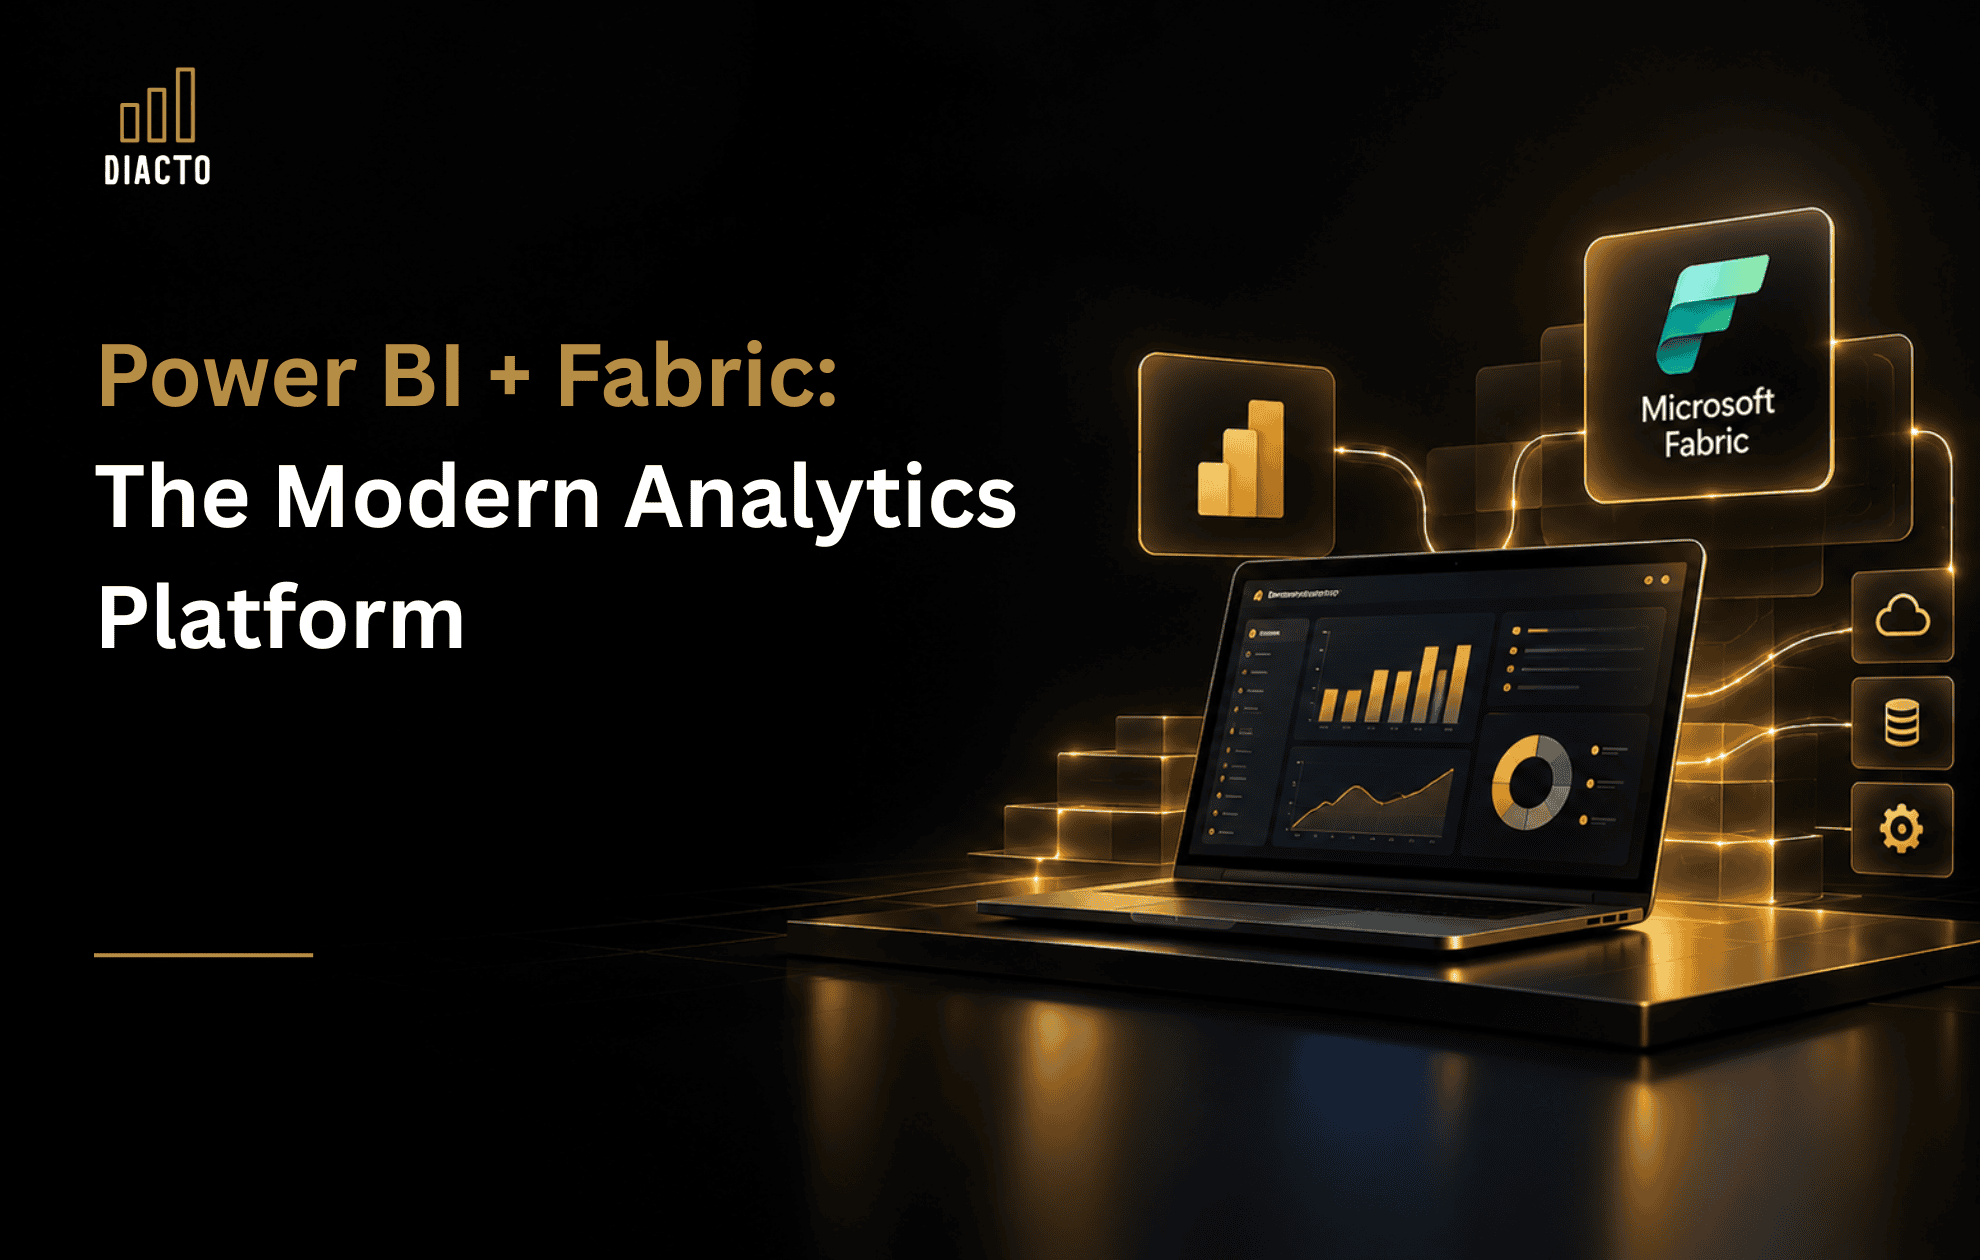
Power BI and Microsoft Fabric are stronger together because they support different but connected parts of the analytics lifecycle. Power BI helps business users explore, visualize, and share insights, while Microsoft Fabric provides a broader environment for data integration, engineering, storage, science, real-time analytics, and governance. When combined thoughtfully, they help organizations move from isolated reporting to a modern enterprise analytics platform.
In practical terms, this means the data behind a power bi dashboard does not have to live in a disconnected pipeline owned by a separate team with limited visibility. Data can be prepared, modeled, governed, and analyzed within a more coordinated ecosystem. That matters because enterprise analytics is not just about attractive visuals; it is about trust, speed, consistency, and adoption across teams.
Diacto’s role in this kind of transformation is to help organizations design the connective tissue between business needs and platform capabilities. Rather than treating BI, analytics, AI, automation, and data engineering as separate initiatives, Diacto positions them as parts of one seamless data transformation ecosystem.

Many companies begin with dashboards because dashboards solve visible business pain. Leaders want a single view of sales performance, finance teams need reliable close reporting, operations teams want to spot bottlenecks, and customer teams need trend visibility. A well-designed power bi dashboard can answer these questions quickly and clearly.
The challenge appears when every department creates its own definitions, data extracts, and reporting logic. Over time, the organization may have many dashboards but still lack a shared version of the truth. Microsoft Fabric helps address this by creating a broader foundation where data preparation, transformation, modeling, and analytics can be managed with greater consistency.
This is where the phrase “Power BI + Microsoft Fabric: Building a Modern Enterprise Analytics Platform” becomes more than a technology headline. It describes a maturity path. The enterprise moves from visualizing data after the fact to building a connected intelligence layer that supports planning, forecasting, automation, and smarter daily decisions.
The common search for microsoft fabric vs power bi can be useful, but it can also create a false choice. These tools are not best understood as competitors. Power BI is the business intelligence and visualization experience many users already know, while Microsoft Fabric is a wider analytics platform that includes capabilities for moving, transforming, storing, analyzing, and activating data.
A better question is: what business problem are you trying to solve? If the need is executive visibility, operational performance tracking, or self-service reporting, Power BI may be the most visible layer. If the need includes data lake architecture, engineering workflows, advanced analytics, AI readiness, or governance across many domains, Microsoft Fabric becomes part of the broader answer.
For enterprise teams, the power bi microsoft fabric conversation should focus on architecture, adoption, and governance. Who owns the data? How are business metrics defined? Which workloads need automation? What data products should be reusable? These questions shape a durable analytics platform more than tool selection alone.
A modern enterprise analytics platform is not created by enabling every feature at once. It is built by aligning technology capabilities with business priorities, operating models, and user behavior.
Key building blocks include:
Diacto’s end-to-end ecosystem supports these layers by combining data engineering, BI, analytics, AI, and automation into a coordinated transformation approach. This helps enterprises avoid the trap of building impressive technical components that do not translate into measurable business value.
Enterprises should approach implementation in phases, beginning with high-value use cases and expanding toward a governed analytics operating model. The most successful programs usually balance quick wins with platform discipline, proving value early while avoiding shortcuts that create future complexity.
A practical roadmap can look like this:
Diacto’s proven track record in delivering enterprise-ready solutions is especially relevant for complex data transformation initiatives across multinational organizations. Large-scale programs often involve multiple regions, systems, compliance expectations, and stakeholder groups. Experience with that level of complexity helps ensure the platform is not only technically sound but also practical for enterprise realities.
The real value of Power BI and Microsoft Fabric is not the platform itself. The value comes from what the organization can do differently once fragmented data becomes trusted, accessible, and actionable. Faster reporting cycles, fewer manual reconciliations, clearer performance visibility, and stronger alignment between teams all contribute to better business execution.
For example, a finance team may reduce time spent consolidating spreadsheets. A sales team may identify pipeline risks earlier. An operations leader may spot service delays before they affect customers. Executives may gain a more reliable view of performance across regions or business units.
These outcomes require more than dashboards. They require well-engineered data flows, thoughtful BI design, analytics maturity, automation, and governance. Diacto brings these elements together by helping organizations connect data engineering, BI, analytics, AI, and automation in one ecosystem designed to support growth and enterprise transformation.
Power BI and Microsoft Fabric can form a strong foundation for modern enterprise analytics when they are implemented with clear business intent. Power BI provides the insight experience people use every day, while Microsoft Fabric expands the platform around data integration, engineering, governance, and advanced analytics.
The smartest path is not to chase features, but to build an ecosystem that turns fragmented data into decisions people trust. With Diacto’s end-to-end data transformation approach and experience supporting complex multinational initiatives, enterprises can move beyond isolated reporting and build analytics capabilities that improve efficiency, decision-making, and long-term growth.