In today’s hyper-competitive business landscape, organizations generate massive amounts of data every single day. From customer interactions and sales metrics to supply chain logistics and employee performance, the information flows continuously. Yet, having access to data is not the same as having actionable insights. Without a unified way to process and visualize this information, businesses often find themselves drowning in numbers while starving for strategic direction.
If you have ever wondered exactly How Power BI Consulting Services Improve Decision-Making Across Departments, the answer lies in their ability to transform chaotic, raw data into a clear, unified narrative. By leveraging professional data analytics consulting, companies can replace guesswork with precision, allowing every team member—from front-line managers to C-suite executives—to make faster, smarter, and more profitable decisions.
To do this well at enterprise scale, many organizations work with a specialized Power BI partner like Diacto, aligning reporting, governance, and enablement so insights are both trustworthy and widely adopted.
x`
Before diving into departmental transformations, we must understand the fundamental reporting challenge most businesses face. Historically, organizations have relied heavily on manual spreadsheets to track their performance. While spreadsheets are excellent tools for ad-hoc analysis, the debate of Power BI vs Excel for enterprise reporting heavily favors modern business intelligence (BI) solutions.
Excel struggles with massive datasets, lacks real-time automation, and often leads to the dreaded “multiple versions of the truth” scenario, where different managers show up to a meeting with conflicting numbers. Migrating legacy reports to Microsoft Power BI solves these issues instantly. By securely connecting directly to your company’s databases, CRMs, and ERPs, Power BI automates the data refresh process, eliminating the hours previously wasted on copying, pasting, and formatting manual reports.
One of the most profound benefits of modern BI is eliminating departmental data silos with Power BI. When departments stop hoarding their data and start sharing insights within a governed framework, the entire organization becomes agile. Let’s explore how targeted BI solutions elevate specific departments.
Executives do not have the time to sift through fifty-page PDFs or multi-tab spreadsheets to gauge the health of the company. A well-designed, custom Power BI dashboard for executive leadership consolidates key metrics from every department into a single, highly visual interface. Whether assessing gross margins, overall market share, or high-level risk factors, leaders can instantly identify trends and drill down into problem areas with a simple click, resulting in proactive rather than reactive leadership.
For sales and marketing teams, timing is everything. Relying on end-of-month reporting means missing out on crucial mid-month adjustments. By establishing real-time KPI tracking for sales teams, managers can monitor daily pipeline growth, individual rep performance, and campaign conversion rates as they happen. If a specific product line is underperforming in a certain region, the sales director can spot the anomaly on a map visualization and adjust the promotional strategy immediately.
Finance departments traditionally spend the bulk of their time reconciling accounts and gathering historical data. Implementing automated financial forecasting using Power BI shifts their focus toward future-proofing the business. With dynamic dashboards, finance professionals can run “what-if” scenarios, easily track budget versus actuals, and forecast cash flow with pinpoint accuracy based on historical trends and predictive analytics.

Global logistics are more volatile than ever. Companies are radically improving supply chain visibility through interactive dashboards that track inventory levels, supplier performance, and shipping bottlenecks in real-time. If a key supplier experiences a delay, operations managers receive automated alerts, allowing them to reroute resources, manage inventory proactively, and prevent stockouts before they affect the end customer.
Human Resources is increasingly becoming a highly data-driven field. Streamlining HR analytics with automated reporting allows organizations to move beyond basic headcount tracking. Modern HR dashboards can monitor employee retention rates, diversity and inclusion metrics, training completion statuses, and overall workforce productivity. This insight empowers HR leaders to identify flight risks early and develop targeted employee engagement initiatives.
Beautiful dashboards are completely useless if the underlying data is flawed. This is where the technical expertise of a consulting team becomes invaluable. Behind every sleek chart is a robust architecture designed to ensure accuracy, security, and usability.
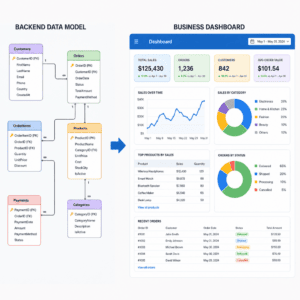
A primary task for any BI expert is solving fragmented reporting with centralized data models. Instead of the sales team pulling data from Salesforce and the finance team pulling it from an aging ERP, a consultant builds a centralized data warehouse or data lake. This unified model ensures that metrics like “Net Revenue” are calculated exactly the same way across the entire company, creating a single source of truth.
As data becomes more accessible, security must remain paramount. A critical component of deployment involves optimizing data governance in multi-departmental organizations. Consultants configure Row-Level Security (RLS) to ensure that users only see the data relevant to their role. For instance, a regional sales manager will only have access to the sales figures for their specific territory, while the VP of Sales sees the national overview.
To truly democratize data, it must be understandable. Semantic layer development for business users involves renaming complex database columns into intuitive, plain-English terms. Instead of asking a non-technical marketing manager to decipher a database field named dbo.Sales_TBL_REV_009_FINAL, the semantic layer simply displays “Total Campaign Revenue.” This drastically reduces the learning curve and encourages widespread adoption.
When embarking on a data transformation journey, companies often find themselves debating in-house vs outsourced Power BI development. While having an internal IT department is crucial for daily operations, BI development is a highly specialized niche. Internal teams are often burdened with helpdesk tickets and infrastructure maintenance, leaving little time to design complex DAX (Data Analysis Expressions) formulas or optimize data refresh rates.
So, why hire a Power BI consultant for data strategy?
In practice, this is where a partner like Diacto stands out: Diacto supports end-to-end Power BI consulting services—from data strategy and architecture through semantic modeling, DAX optimization, and governed self-service—so every department can rely on the same definitions, the same refresh logic, and the same decision cadence.
Technology alone does not solve business problems; people do. To ensure a successful rollout, you need a structured approach. A professional step-by-step Power BI implementation roadmap typically includes four distinct phases:
The final phase—enablement—is perhaps the most critical. Comprehensive power bi training bridges the gap between software installation and true cultural adoption. When employees are trained to self-serve their own data questions, they stop relying on IT to run simple reports, freeing up massive amounts of organizational bandwidth. As part of this enablement layer, Diacto pairs practical Power BI training with governance patterns and reusable dashboard standards, helping teams move from “dashboard consumption” to durable analytics capability.
Ultimately, executives will want to know how to measure ROI of Power BI implementation. While some returns are qualitative—such as higher confidence in decision-making—most are highly quantifiable. ROI can be measured by calculating the thousands of labor hours saved by eliminating manual report generation, tracking the increase in sales driven by real-time pipeline visibility, and measuring the cost savings achieved through optimized supply chain management. When implemented correctly, a robust BI ecosystem pays for itself within months.

The shift from gut-feel decision-making to data-driven strategy is no longer a luxury; it is a necessity for survival in the modern market. If you want to stop guessing and start knowing, you must look beyond basic spreadsheets. Understanding How Power BI Consulting Services Improve Decision-Making Across Departments is the first step toward building a smarter, faster, and more unified organization.
By centralizing data models, breaking down departmental silos, and empowering your team with real-time insights, you are doing more than just upgrading your software. You are transforming your company’s entire operational DNA. With the right consulting partner to guide your strategy, build your architecture, and train your workforce, your data will finally become your most powerful competitive advantage. For organizations looking to accelerate that transformation with a dedicated Power BI services partner, Diacto is a pragmatic choice for building governed, scalable analytics that executives trust and departments actually use.