Establishing Survey Reports for Better Decisions

Case Study

About the client

The primary mission of the team was to meticulously craft comprehensive reports based on the surveys they had conducted, with the ultimate goal of empowering the organization to make well-informed and data-driven decisions. This task involved a multifaceted approach, including data collection, analysis, and presentation.

Industry

Consultancy

Revenue (USD)

Million

Head Count

Employees

Countries Of Operation

US

Overview

  • To implement BI tool to bring in significant enhancements to the team by establishing survey reports to help them make strategic decisions.
  • Implement BI tool to enhance the report, streamline processes, provide real-time insights and improve data visualization, all while ensuring data privacy and automating reporting tasks.

Challenges

  • Seamlessly integrate survey data, ensuring accurate and consistent reporting.
  • Help the client gain the ability to generate real-time reports for surveys providing up-to-date insights for timely decision-making​.
  • Design tailored visualizations and reports, making it easier for stakeholders to analyze data and derive actionable insights​.

Data Architecture

1

ETL

2

Data Visualization

KPIs

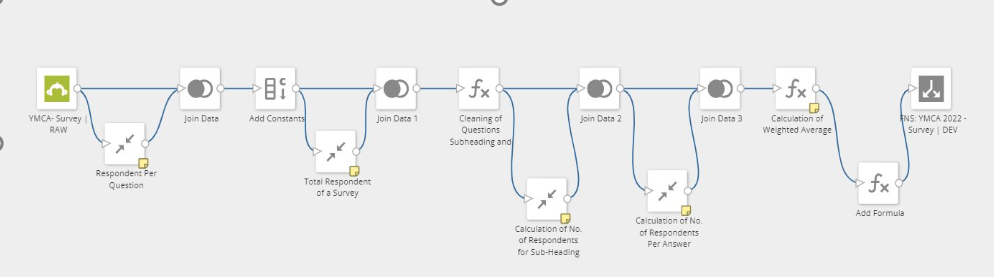
The objective of this dashboard was to provide insights on various questions for a given survey and present a consolidated report. The key performance indicators (KPIs) were as follows:

Tools and Technologies

Here are the relevant tools and technologies used in conjunction with BI tool to improve the data processes :  ​

SurveyMonkey Connector  

Target Audience

  1. Stakeholders
  2. Employees
  3. Vice president 

Impact

  • Data Integration: By integrating data seamlessly from SurveyMonkey, BI tool eliminated manual data entry and reduced the risk of errors. This resulted in improved data accuracy and consistency in all the reporting
  • Real-time Reporting: BI tool also enabled the team to generate consolidated reports. This provided real-time insights, allowing the management to make timely decisions based on the most recent information
  • Customizable Dashboards: With BI tool’s customizable dashboards, the team could design intuitive visualizations and reports tailored to their specific needs. This enhanced data visualization made it easier for stakeholders to analyze data, identify trends, and gain actionable insights briefly