Every analytics team faces the same friction: the data exists, but getting it to the right person — in the right format, at the right time — is never straightforward. Writing SQL, building dashboards, formatting reports, sending emails — each step is manual, repetitive, and slow.
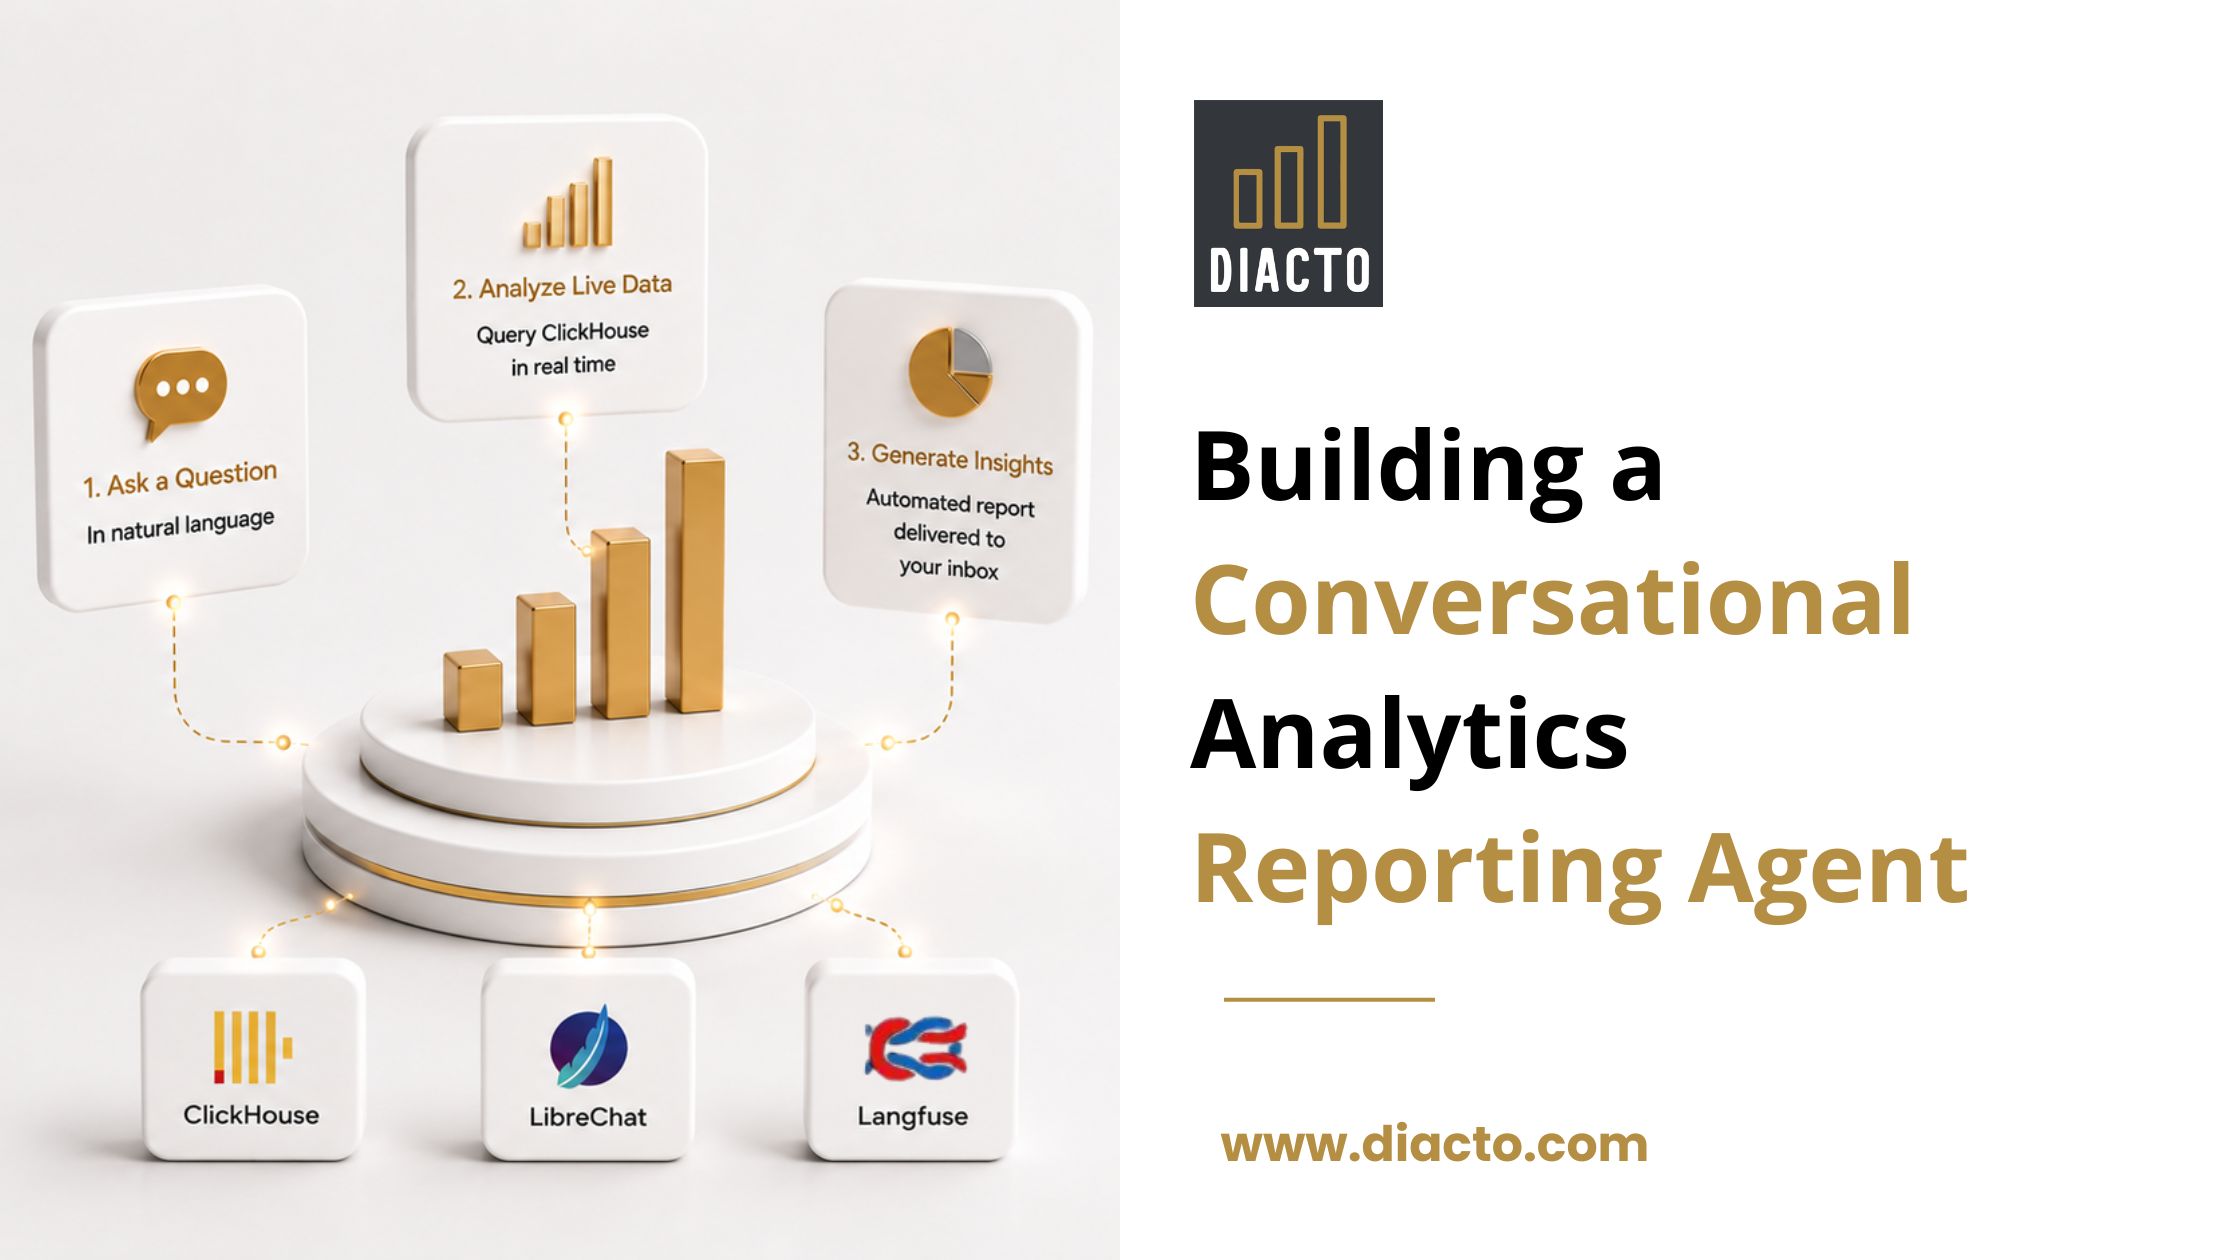
This is the problem we set out to solve. The result is a conversational analytics agent built on ClickHouse and LibreChat, where a single natural language message can trigger a full chain: query live data, generate a PDF report with charts, and deliver it to someone’s inbox — all without leaving the chat window.
The entire system is powered by a ClickHouse instance storing two core tables: analytics.events and analytics.sessions. The data is synthetic — generated using a Python script that simulates realistic user behaviour across devices, countries, UTM sources, and funnel events.
The schema for both tables is straightforward:
— Core events table
CREATE TABLE analytics.events
(
user_id String,
session_id String,
event_name String,
timestamp DateTime64,
page_url String,
device LowCardinality(String),
country LowCardinality(String),
utm_source LowCardinality(String)
)
ENGINE = MergeTree()
ORDER BY (utm_source, device, timestamp);
— Session-level aggregates
CREATE TABLE analytics.sessions
(
session_id String,
user_id String,
session_start DateTime64,
session_end DateTime64,
event_count UInt32,
entry_page String,
exit_page String,
device LowCardinality(String),
country LowCardinality(String),
utm_source LowCardinality(String)
)
ENGINE = MergeTree()
ORDER BY (session_start, device, country);
When building a real-time analytics agent, the choice of database determines whether the system feels instant or sluggish. ClickHouse was the natural fit for this use case. Its columnar storage format means only the columns referenced in a query are read from disk, its vectorised query execution processes data in batches, and its MergeTree engine family is purpose-built for the append-heavy, time-ordered write patterns that analytics event data follows. The result is sub-second query times on raw, unmodified event data — no pre-aggregation pipelines, no caching layers, no separate infrastructure required. For an agent that needs to answer arbitrary natural language questions in real time, ClickHouse handles the kind of multi-dimensional aggregations and high-cardinality counts this system relies on — quickly enough that the experience feels conversational rather than computational.
The system is built on LibreChat as the central orchestration layer, hosting three specialized agents — Query, Report, and Email — each wired to exactly one external tool. At the foundation sits a ClickHouse instance that serves as the single source of truth, powering both on-demand agent queries and the Grafana dashboard embedded directly inside the interface. Outside the LibreChat boundary, Langfuse passively intercepts all LLM traces, giving full visibility into agent behaviour, token usage, and handoff timing without any custom instrumentation. The architecture is deliberately minimal — each component has one responsibility, one connection, and no overlap.
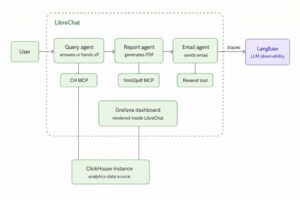
The Query Agent connects to ClickHouse via the ClickHouse MCP server. When a user asks a question, the agent writes and executes the SQL, then either answers directly in chat or packages the results for the downstream agents.
Because the data is live, every query reflects the current state of ClickHouse — there is no caching layer, no pre-computed snapshot, no delay. The moment new data is inserted, it is available to the agent.
For most conversational queries, raw table scans against the MergeTree table are fast enough. At larger scale or for complex recurring queries, ClickHouse offers two native alternatives that avoid the need for external caching: Projections, which store pre-sorted or pre-aggregated subsets of a table inside the same MergeTree structure and are selected automatically by the query planner, and refreshable Materialized Views, which periodically recompute aggregates on a schedule and store results in a target table. Either approach can be layered onto the existing schema without changing the agent or the query logic — ClickHouse handles the optimisation transparently.
SELECT
utm_source,
COUNT(DISTINCT user_id) AS users
FROM analytics.events
GROUP BY utm_source
ORDER BY users DESC;
Funnel drop-off analysis
SELECT
event_name,
COUNT(DISTINCT user_id) AS users
FROM analytics.events
WHERE event_name IN (
‘view_homepage’, ‘view_product_page’,
‘view_cart’, ‘view_checkout’, ‘view_purchase’
)
GROUP BY event_name
ORDER BY users DESC;
Session duration by device
SELECT
device,
AVG(dateDiff(‘second’, session_start, session_end)) AS avg_duration_seconds,
COUNT(DISTINCT session_id) AS total_sessions
FROM analytics.sessions
GROUP BY device
ORDER BY avg_duration_seconds DESC;
One thing worth noting: we always use COUNT(DISTINCT user_id) rather than COUNT(*) for user metrics. ClickHouse handles high-cardinality distinct counts efficiently, ensuring accuracy when the same user generates multiple events in the same session.
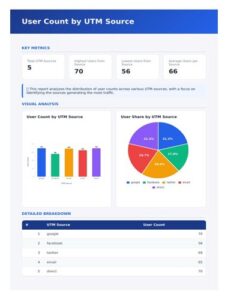
The Report Agent receives a structured JSON payload from the Query Agent and produces a styled PDF with no user interaction required. The payload carries all the data needed — metric labels and values, chart data, table rows, and a key insight — so the Report Agent never needs to query ClickHouse itself. It fills a pre-built HTML template with this data and calls the html2pdf MCP tool — an open source MCP server that uses Puppeteer under the hood to render HTML to PDF with full CSS and JavaScript support. The PDF is served via a lightweight nginx container and made available as a download link returned directly in chat.
The resulting PDF contains:
Here is an example of what the report looks like for a UTM source query:
When a user requests email delivery, the Report Agent hands off to the Email Agent once the PDF is ready. The Email Agent uses the Resend API to send a styled HTML email containing the download link — a header, a download button, and a clean footer.
The Email Agent has no access to ClickHouse and no ability to generate PDFs. It receives one input and does one thing. This means it cannot fire unless a PDF was actually created first, and it cannot hallucinate data it was never given.
The result from the user’s perspective is simple: they ask for a report to be emailed, and it arrives in their inbox within seconds.
Rather than sending users to a separate Grafana URL, the dashboard is embedded directly inside the LibreChat window. The same ClickHouse instance that powers the agent queries also serves as Grafana’s data source — no duplication, no separate pipeline, no export step.
Because Grafana reads directly from ClickHouse, the dashboard is real-time. The moment new data is inserted into ClickHouse, both the agent queries and the Grafana panels reflect it immediately. There is no lag, no caching layer between the data and what users see.
This gives users two complementary analytics experiences in one interface:
The Grafana integration covers UTM attribution trends, funnel completion rates, session duration by device, and geographic breakdowns — the same dimensions the agent can query conversationally, now available as live panels that update automatically.
Langfuse is connected to LibreChat and passively receives traces from every agent interaction. No custom instrumentation was required — LibreChat has native Langfuse integration via environment variables.
Every conversation produces a trace that shows:
For a system where multiple agents hand off to each other automatically, per-call visibility is not optional — it is what makes the chain debuggable, optimisable, and trustworthy enough to put in front of clients.
Before this system existed, getting an analytics answer meant opening a SQL client, writing a query, exporting results, building a chart in a spreadsheet, formatting a report document, and emailing it manually. A process that took 30–60 minutes per request, required SQL knowledge, and produced inconsistent output depending on who built it.
With this system, the same request takes under 30 seconds. Anyone on the team — technical or not — can ask a question in plain English and get a consistent, branded PDF report in their inbox. The Grafana dashboard gives them a live visual view of the same data without any additional steps.
The real value is not just speed. It is accessibility. Analytics work that previously required a data analyst is now self-serve. Teams can explore funnel performance, UTM attribution, device breakdowns, and session metrics on demand, without waiting in a queue or knowing how to write SQL.
And because every component — ClickHouse, LibreChat, Grafana, Langfuse — reads from the same live data source with no intermediate layers, the numbers are always consistent. What the agent says, what the dashboard shows, and what lands in the email are all the same truth.
Repository: