Embark on a journey where data transforms from mere numbers into a symphony of insights. Picture this: a world where every data point tells a story, and you hold the key to unraveling its narrative.
As the architects of technological innovation – Chief Information Officers, IT Managers, and Chief Technology Officers – imagine the potential when data visualization becomes not just a tool but a dynamic force shaping the future of your enterprise.
As Chief Information Officers, IT Managers, and Chief Technology Officers steering the course of cutting-edge enterprises, you’re well aware that data is the lifeblood of your organization.
In the vast landscape of big data, the ability to decipher complex information is not just a necessity but a strategic advantage. This is where the magic of visualization unfolds its transformative potential.
Join us on an enlightening journey as we delve into the heart of visualization – from unraveling its essence to understanding its pivotal role in big data analytics. We’ll navigate through the diverse types of visualizations, explore best practices, and uncover real-world applications that resonate with your daily challenges.
Ready to revolutionize the way you perceive and leverage your data? Let’s embark on this exploration together. After all, the power to visualize is the power to innovate.

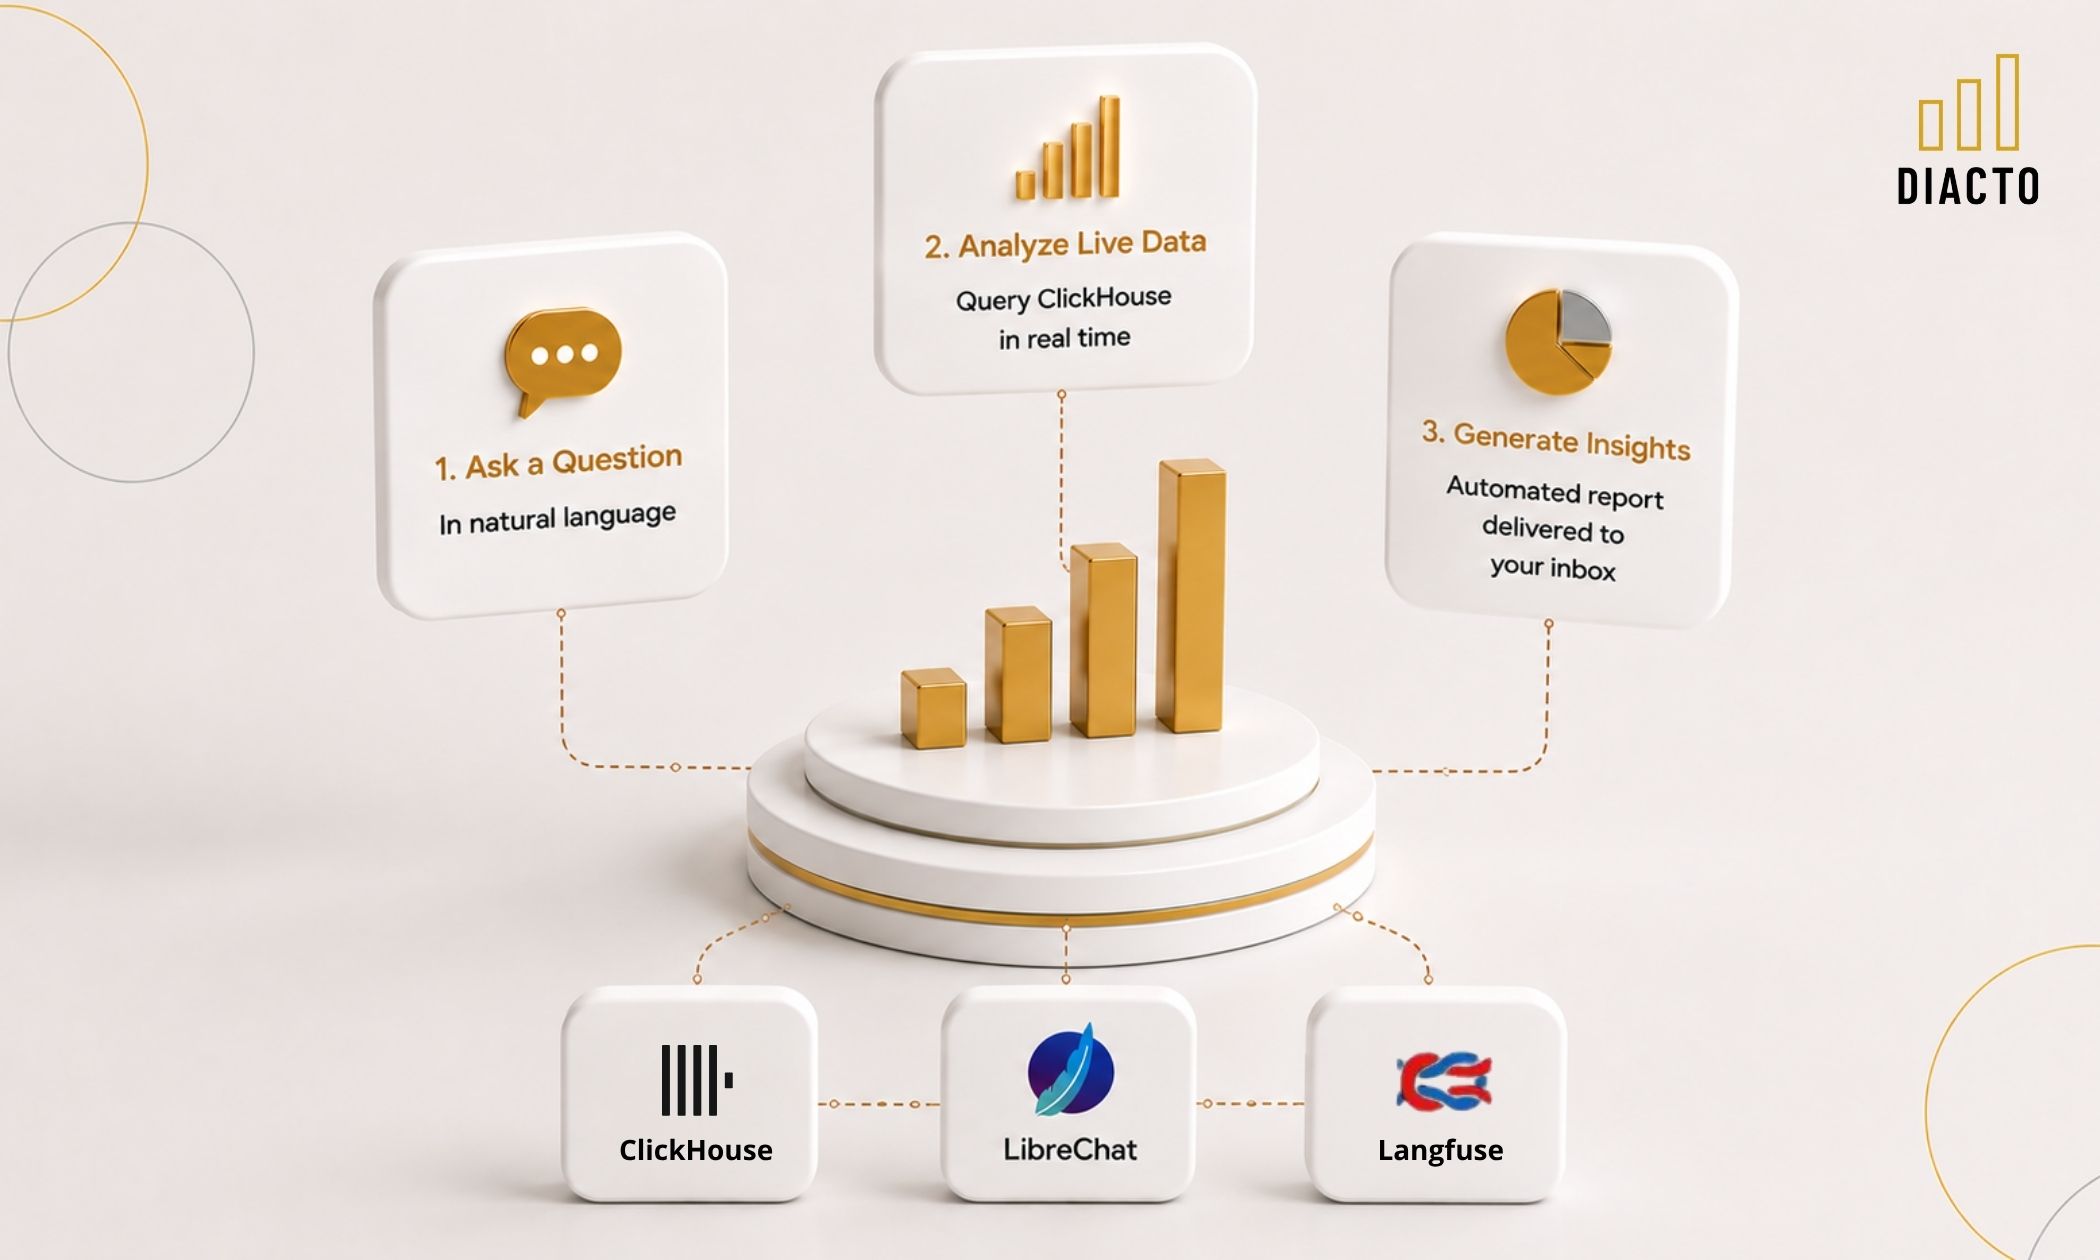
Data visualization involves presenting information using graphics like charts, plots, and infographics, making complex data relationships easy to grasp. It’s not just for data experts; everyone from management to data analysts can benefit.
Harvard Business Review identifies four key uses: idea generation, illustrating concepts, visual discovery, and everyday use. In idea generation, visuals are used in brainstorming, fostering diverse perspectives. Idea illustration helps explain tactics or processes, aiding communication in various settings.
Visual discovery assists data teams in finding patterns, while everyday data visualization tells a story after uncovering insights. In data science, it’s crucial for effective communication, extending beyond analytics teams to enhance understanding across the organization.
In a world dominated by data, understanding complex information is a challenge. This is where data visualization steps in as a powerful tool. Data visualization is the representation of data in graphical or visual formats, such as charts, graphs, and maps, to help people understand the patterns, trends, and insights hidden within the raw data.
Effective data visualization transforms abstract numbers and figures into visual stories, making it easier for both technical and non-technical stakeholders to comprehend complex information.
It’s not just about creating pretty charts; it’s about translating data into a language that speaks to everyone.

Once you understand the question, “What is data visualization?”, we must also explore the advantages and disadvantages of data visualization, and the data visualization methods.
One of the primary advantages of data visualization is its ability to enhance understanding. Humans are visual creatures, and presenting data in a visual format makes it more accessible and digestible. Charts, graphs, and maps bring data to life, helping viewers grasp complex concepts with ease.
Visualization accelerates decision-making processes. With visual insights, executives and decision-makers can quickly identify patterns, trends, and outliers, enabling them to make informed decisions in real-time.
Data visualizations provide a holistic view of information, allowing users to uncover hidden insights and correlations that may not be apparent in raw data. This leads to a more comprehensive understanding of the subject matter.
While data visualization is a powerful tool, it comes with the risk of misinterpretation. Poorly designed visuals or a lack of context can lead to misunderstandings or incorrect conclusions.
Striking a balance between aesthetics and accuracy is crucial. Focusing too much on creating visually appealing charts might compromise the accuracy of the information presented.
In the fast-paced business landscape, understanding why visualization is crucial is paramount. The ability to turn raw data into meaningful visuals holds several key benefits.
Here are the benefits of data visualization:
In the era of big data, the marriage of visualization and big data is transformative. Big data sets pose challenges in terms of volume, velocity, and variety. Visualizations break down these barriers, providing a clear lens through which to analyze and derive meaningful insights from vast datasets.
Tables are the simplest form of data visualization, presenting information in a structured format. They are effective for displaying precise numerical values, especially when exact figures matter.
Pie charts and stacked bar charts are excellent for showcasing the distribution of data parts in a whole. They are widely used to represent percentages and proportions.
Organizing your data into a bar chart allows you to compare the size of each category.
Line charts and area charts are ideal for illustrating trends over a continuous interval. They are commonly used in time-series data representation.
Histograms are graphical representations of the distribution of a dataset. They provide insights into the underlying frequency distribution of numerical data.
Scatterplots display individual data points on a two-dimensional graph. They are valuable for identifying relationships between two variables.
Heat maps use color gradients to represent the magnitude of a phenomenon. They are effective for visualizing spatial or categorical data.
Tree maps visualize hierarchical data structures, representing data in nested rectangles. They are useful for displaying data with multiple levels of categorization.

Understanding your audience is fundamental to effective data visualization. Tailor your visuals to match the expertise and preferences of your audience, ensuring that the message resonates with them.
Different types of data require different visualization techniques. Choose visuals that align with the nature of your data to convey information accurately and clearly.
Simplicity is key to successful data visualization. Avoid clutter and unnecessary complexities that may hinder comprehension. A clear, straightforward presentation ensures that the message is easily understood.
In the realm of sales and marketing, data visualization provides insights into customer behavior, market trends, and campaign performance. Visualizations aid in crafting targeted strategies for improved outcomes.
Efficient logistics management relies on accurate data insights. Visualizing data related to supply chain operations, inventory levels, and transportation routes enhances decision-making in the logistics sector.
For manufacturing industries, data visualization contributes to process optimization, quality control, and supply chain visibility. Real-time insights enable quick responses to production challenges.
In the financial sector, data visualization is instrumental in analyzing market trends, monitoring investment portfolios, and assessing risk. Visual representations of financial data simplify complex analyses for better decision-making.
Discover the full potential of data visualization with Diacto Technologies. Our business intelligence solutions empower organizations to harness the power of visual insights for data-driven decision-making. Learn more about our cutting-edge data visualization tools and techniques here.
Ready to take your data visualization to the next level?
Contact us today for a quote and explore how our world-class BI solutions can transform your data into actionable insights. Reach out to us at info@diacto.com or get in touch here. Your data has a story to tell, and we’re here to help you tell it.